|
|
Pop-ups for inspect/display
|
Evaluation pop-ups are now used for all
Display and Inspect results.
|
|
|
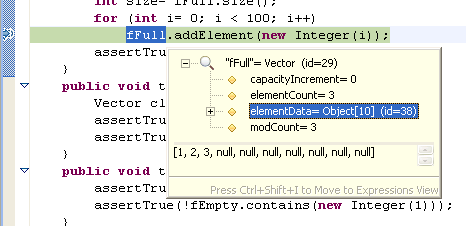
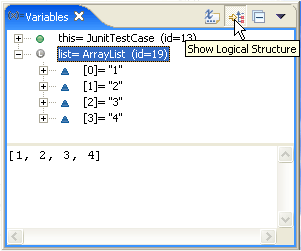
Logical Structure
|
The Java debugger now allows
certain Java types, including collections and maps, to be displayed in a
more compact and meaningful form. These logical structures are
controlled by a toggle button in the Variables view.
 |
|
|
System thread filter |
System threads are now filtered out from the Debug View by
default. The Show System Threads command in the view's drop-down
menu toggles the filter on/off. |
|
|
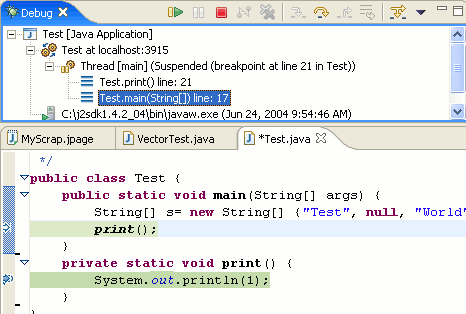
Step Into Selection on any line
|
The Java debugger's Step Into Selection
command is no longer restricted to the currently executing line. |
|
|
Class prepare breakpoints
|
Breakpoints can be set on a class prepare
event. The program will be suspended when the specified class or
interface is first loaded by the Java VM.
|
|
|
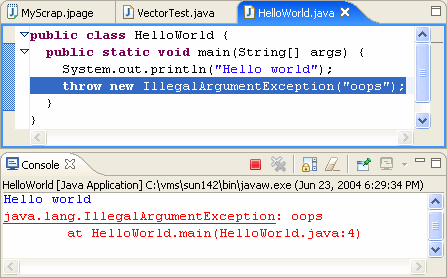
Exception breakpoint hyperlinks
|
Exception breakpoints can be now created
directly from a stack trace in the console. Clicking on the hyperlink
that appears under the exception name at the beginning of a stack trace
opens a properties dialog on the newly created (or already existing)
exception breakpoint.
|
|
Breakpoints in external source
|
You can now put a breakpoint in external
source code (i.e., source code that is not on the build classpath of a
Java project). The breakpoint creation actions on the Run menu
automatically create external breakpoints whenever the debugger is
displaying external source. |
|
|
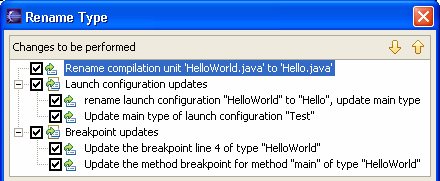
Refactorings update breakpoints and launch
configurations
|
Breakpoints and launch configurations are now
updated as a consequence of Java source code refactorings such as
renaming a Java project, source file, or type declaration.
|
|
|
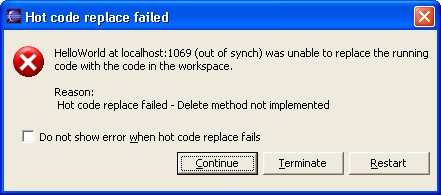
Restart option when hot code replace fails
|
When changes are made in the host Java VM
that hot code replace does not support, you now have the option to
Restart the VM in addition to choosing Continue or Terminate.
|
|
|
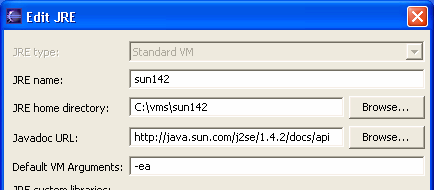
Default VM arguments can be associated with a JRE
|
The Java > Installed JREs
preference page now lets you associate a set of default VM arguments
with each JRE. These arguments will be passed to the VM whenever it is
used.
|
|
|
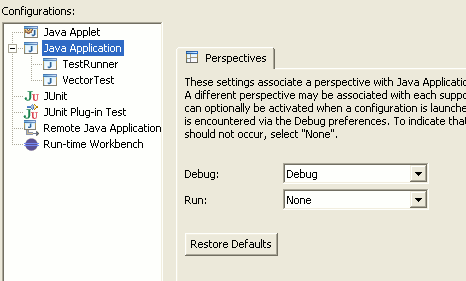
Switching perspective on launch
|
The debugger can be configured
to switch perspectives on launch (see Preferences > Run/Debug >
Launching).
You can now control which perspective gets opened when a program is
launched. These setting are available on the launch dialog when a launch
configuration type is selected.
|
|
|
Debugging in current perspective |
Debugging can now be performed in any perspective. When a breakpoint
is encountered you will be prompted to switch to the Debug perspective.
If you choose to remain in the current perspective, the Debug view and
action set will be opened allowing you to start debugging.
You can configure the debugger to open debug-related views
(Variables, Breakpoints, etc.), in non-debug perspectives via the Run/Debug
> View Management preference page (also available from the
drop-down menu in the Debug view). |
|
|
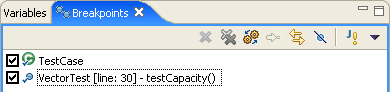
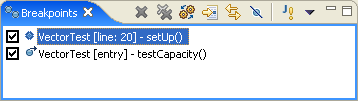
Disabling breakpoints |
The Breakpoints view now has checkboxes for quickly disabling
and re-enabling breakpoints:
|
|
|
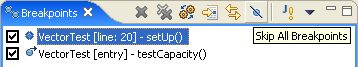
Skipping breakpoints
|
The new Skip All Breakpoints button
turns off all breakpoints in the workspace. There are also new
preference on the Run/Debug preference page to skip breakpoints
during run-to-line and evaluations.
|
|
|
Workspace checked for breakpoints before running
|
When an application is launched in run mode
with breakpoints set in the workspace, the user will be prompted to see
whether the launch should be in debug mode. This feature is turned on
and off from the Run/Debug preference page.
|
|
|
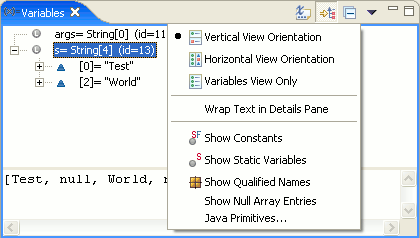
Filters for arrays
|
You can now filter out null array elements in
the debug Variables view.
|
|
|
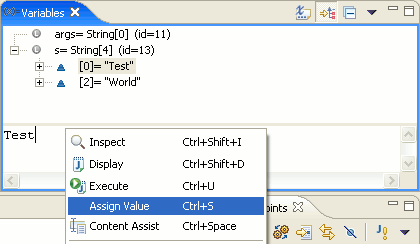
Setting variables in variables view
|
The value of the selected variable in the
Variables View can now be changed in the details area of that view by
typing the new value and using the context menu's Assign Value
command (Ctrl+S).
|
|
|
Highlighting of lines in execution call stack
|
New annotations have been added by Java debug
for highlighting the current instruction pointer and frames in the
execution call stack. You can configure these annotations from the Java
editor Java > Editor > Annotations preference page.
|
|
|
Launching from context menu |
Launch shortcuts are now available in the context menu of all
applicable views - Navigator, Outliner, etc. Run and Debug are now
separated into different submenus. The JUnit shortcut allows you to
select and launch a single test method.
An Ant build can be invoked from the Run context menu. You can run
the entire build file, or open a dialog to select specific targets. You
can also select and run individual targets from the Ant editor outline
and Ant view.

|
|
|
More support for string substitution variables
|
Variables are now supported in various fields
of launch configurations such as VM arguments, program arguments, and
the working directory.
|
|
|
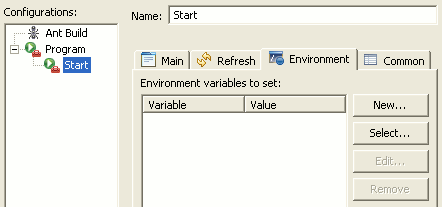
Environment variables
|
Some launch configuration types
make use of a new Environment tab for specifying the environment
variables to use when a configuration is launched.
|
|
|
Working sets for external tool builders
|
When Ant is being used as a
builder, it can now be set to trigger on changes to files in a specified
working set.
|
|
|
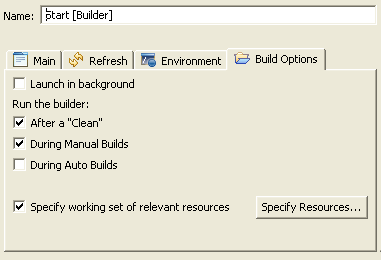
Disable external tools builders
|
Project builders can be disabled and re-enabled via checkboxes on the
Builders project property page.
|
|