
| Virtual Machine Analysis User Documentation | ||
|---|---|---|

|

|
|
| Table of Contents | Virtual Machine Analysis Developer Documentation | |
Virtual environments are usually composed of host machines, who each run an hypervisor program on which one or many guests can be run. Tracing a guest machine alone can often yield some strange results as from its point of view, it has full use of the resources, but in reality, most resources are shared with the host and other guests.
To better understand what is happening in such an environment, it is necessary to trace all the machines involved, guests and hosts, and correlate this information in an experiment that will display a complete view of the virtualized environment.
A trace has to be taken for each machine, guest and host, in the virtualized environment. The host trace is the most important to have, as missing guests will only give an incomplete view of the system, but missing hosts usually won't allow to identify the hypervisor, nor determine when a guest is preempted from the host CPUs. The virtual machine analysis only makes sense if the host trace is available.
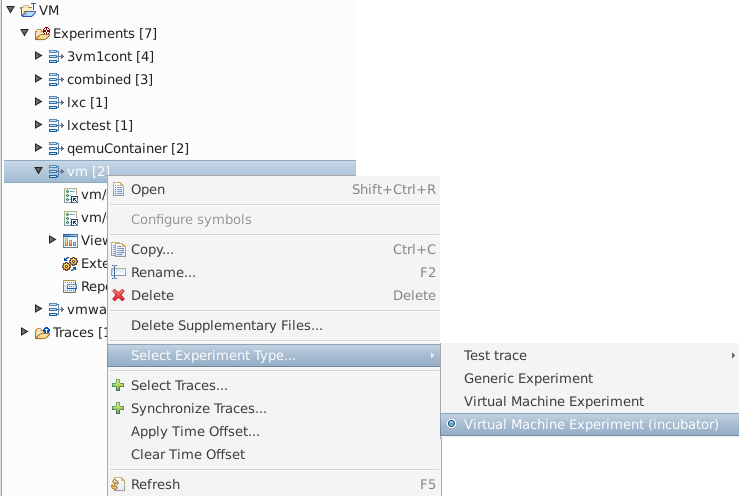
Once all the traces are imported in Trace Compass, they can be added to an experiment. The type of the experiment should by set to Virtual Machine Experiment by clicking on the right mouse button over the experiment name, then selecting Select Experiment Type....

Depending on the hypervisor used, traces might need to be synchronized so that they have the same time reference and their events can be correctly correlated.
The Virtual CPU view shows the status of CPUs and threads on guests augmented with the preemption and hypervisor data we get from the host.
In the image below, we see for the virtual CPU status that it has a few more states than the CPUs in the Resources View: in red and purple respectively, when the virtual CPU is running hypervisor code and when the CPU is preempted on the host.
The entries for each thread of the machine corresponds to the one from the Control Flow View, augmented with the data from the Virtual CPU, so that we see that even though it is running from the guest's point of view, it is actually not running when the Virtual CPU it runs on is in preempted or hypervisor mode.

In order to be able to correlate data from the guests and hosts traces, each hypervisor supported by Trace Compass requires some specific events, that are sometimes not available in the default installation of the tracer.
The following sections describe how to obtain traces for each hypervisor.
The Qemu/KVM hypervisor require extra tracepoints not yet shipped in LTTng for both guests and hosts, as well as compilation with the full kernel source tree on the host, to have access to kvm_entry/kvm_exit events on x86.
Obtain the source code with extra tracepoints, along with lttng-modules
   # git clone https://github.com/tahini/lttng-modules
   # cd lttng-modules
Checkout the addons branch, compile and install lttng-modules as per the lttng-modules documentation.
   # git checkout addons_vm
   # make
   # sudo make modules_install
   # sudo depmod -a
On the host, to have complete kvm tracepoints support, the make command has to include the full kernel tree. So first, you'll need to obtain the kernel source tree. See your distribution's documentation on how to get it. This will compile extra modules, including lttng-probe-kvm-x86, which we need.
# make KERNELDIR=/path/to/kernel/dir
The lttng addons modules must be inserted manually for the virtual machine extra tracepoints to be available:
   # sudo modprobe lttng-addons
   # sudo modprobe lttng-vmsync-host # on the host
   # sudo modprobe lttng-vmsync-guest # on the guest
The following tracepoints will be available
   # sudo lttng list -k
   Kernel events:
   -------------
     ...
     kvm_entry (loglevel: TRACE_EMERG (0)) (type: tracepoint)
     kvm_exit (loglevel: TRACE_EMERG (0)) (type: tracepoint)
     vmsync_gh_guest (loglevel: TRACE_EMERG (0)) (type: tracepoint) # on the guest
     vmsync_hg_guest (loglevel: TRACE_EMERG (0)) (type: tracepoint) # on the guest
     vmsync_gh_host (loglevel: TRACE_EMERG (0)) (type: tracepoint) # on the host
     vmsync_hg_host (loglevel: TRACE_EMERG (0)) (type: tracepoint) # on the host
     ...
Host and guests can now be traced together and their traces added to an experiment. Because each guest has a different clock than the host, it is necessary to synchronize the traces together. Unfortunately, automatic synchronization with the virtual machine events is not completely implemented yet, so another kind of synchronization needs to be done, with TCP packets for instance. See section on trace synchronization for information on how to obtain synchronizable traces.

|

|

|
| Table of Contents | Virtual Machine Analysis Developer Documentation |