|
| Threads
and Monitors view |
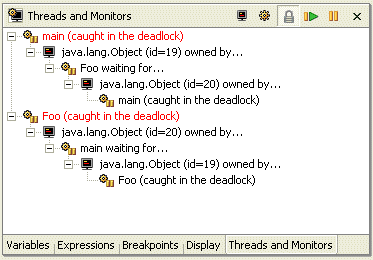
The debugger's new Threads and
Monitors view shows which threads are holding locks and which are
waiting to acquire locks.

|
|
| Instance
breakpoints and watchpoints |
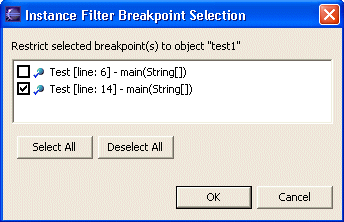
You
can now set breakpoints & watch points specific to a particular object
instance. In the Variables view, choose Instance Breakpoints...
from the variables context menu.

|
|
| Improved
conditional breakpoints |
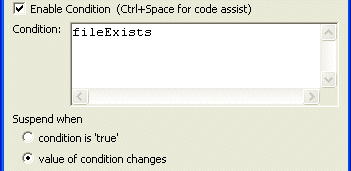
A
traditional conditional breakpoint is triggered by a boolean expression
evaluating to "true". It is now possible to declare conditional
breakpoints that are triggered whenever the value of an expression
changes. In addition, code assist is now available when typing the in the
conditional expression.

|
|
| Stepping
into selections |
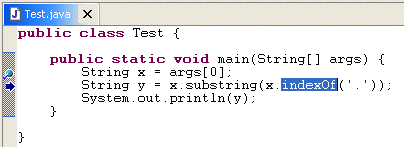
The Java debugger now allows you to step
into a single method within a series of chained or nested method calls.
Simply highlight the method you wish to step into and select Step into
Selection from the Java editor context menu.

|
|
| Watch
items |
You
can create watch item by selecting an expression in the Java editor and
using the Watch action (available in the context menu, and in the Run
menu). As well, a watch item can be created by selecting a variable and
using the Watch action. |
|
| Step
filters |
Step
filters are more convenient to use now that a Step With Filters
action has been added to the debug toolbar and menu. As well, actions have
been added to the debug context menu to streamline the creation of step
filters for the type or package associated with the selected stack frame. |
|
| Word
wrap in Variables view |
The
details area of the debugger's Variables and Expressions
views now supports word wrap, available from the view drop-down menu.

|
|
| Stack
trace hyperlinks |
Java stack traces in the console now
appear with hyperlinks. When you place the mouse over a line in a stack
trace, the pointer changes to the hand and the stack trace is underlined.
Pressing the mouse button opens the associated Java source file and
positions the cursor at the corresponding line.

|
|
| Console
buffer size |
The
Console view retains only the most recent N characters of output (default
is 80K). The console buffer size can be configured via the Debug >
Console preference page. |
|
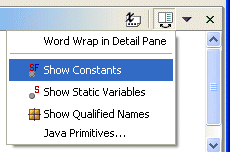
| Filtering
constants & statics |
Two new actions are available in the
pull-down menu of the Variables view - Show Constants & Show
Static Variables. These actions toggle the visibility of static final
and static variables.

|
|
| Faster
stepping |
The performance of the debugger's Run
> Step over (F6) action has been improved. You should notice the
difference when holding down the F6 key or rapidly clicking the Step
Over button.
|
|
| Instruction
pointer |
When debugging, the Java editor now
indicates the currently executing line with an arrow in the left margin.
This arrow is solid for the top stack frame and hollow for non-top stack
frames.

|
|
