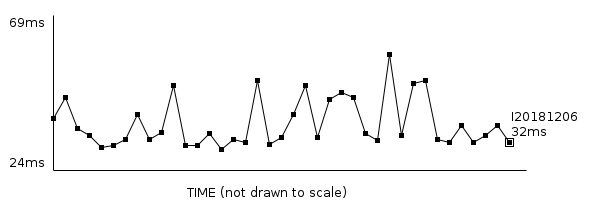
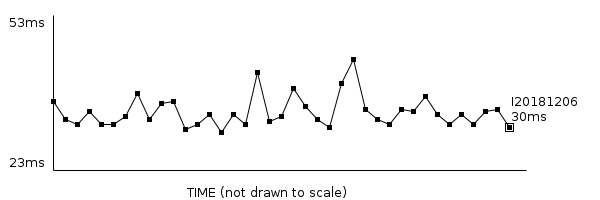
Scenario: org.eclipse.jdt.text.tests.performance.DocumentPerformanceTest#measureInsertAtStart() (SUSE Linux Enterprise Server 12 (x86_64))
Raw data and Stats
Click measurement name to view line graph of measured values over builds.
| Build Id | Elapsed Process | CPU Time |
| I20181206-0815 | 32ms [0ms] | 30ms [0ms] |
| I20181001-0920 | 39ms [0ms] | 35ms [0ms] |
| *Delta | 7ms
17.9 % | 5ms
14.1 % |
*Delta values in red and green indicate degradation > 10% and improvement > 10%,respectively.
Black and yellow points plot values measured in integration and last seven nightly builds.
Magenta points plot the repeated baseline measurement over time.
Boxed points represent previous releases, milestone builds, current reference and current build.
Hover over any point for build id and value.
Elapsed Process
Elapsed Process

CPU Time
CPU Time


