The Open Tracing API is a vendor-neutral API for distributed tracing and context propagation.
Trace compass currently support the Jaeger tracer trace format which is a .json file.
All you need to know to start tracing can be found on Jaeger Tracing website.
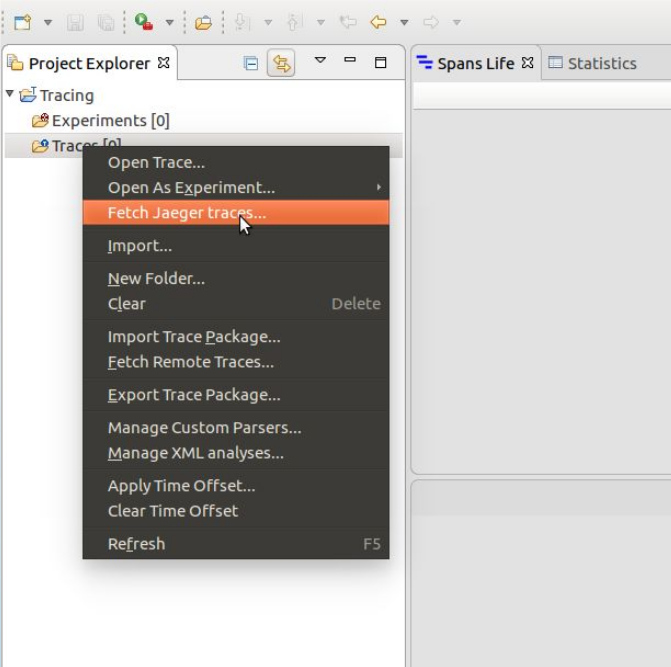
Once you have Jaeger running and traced some traces, you can fetch those traces directly into Trace Compass. All you need to do is right click on the Traces folder in the Project Explorer.

You will be able to set all the filters you want to apply to your traces request. Once you click the fetch button, you will see a list of traces which you can select the ones you want to import from.
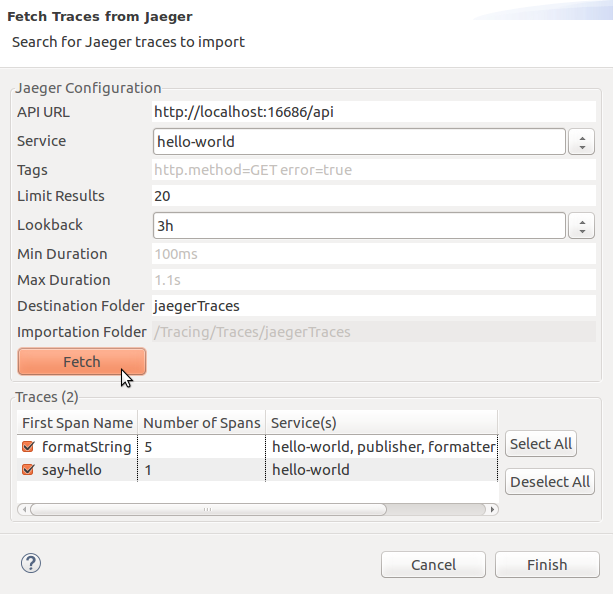
Once you click finish, your traces will be imported in your workspace.
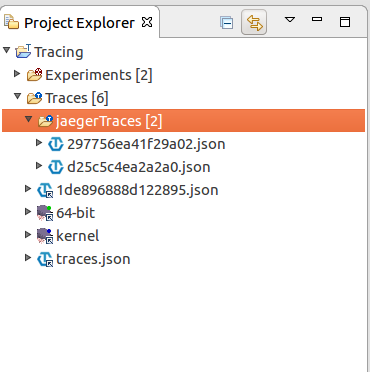
When you open an Open Tracing trace (double click on any imported trace), you should obtain a view that looks like this.
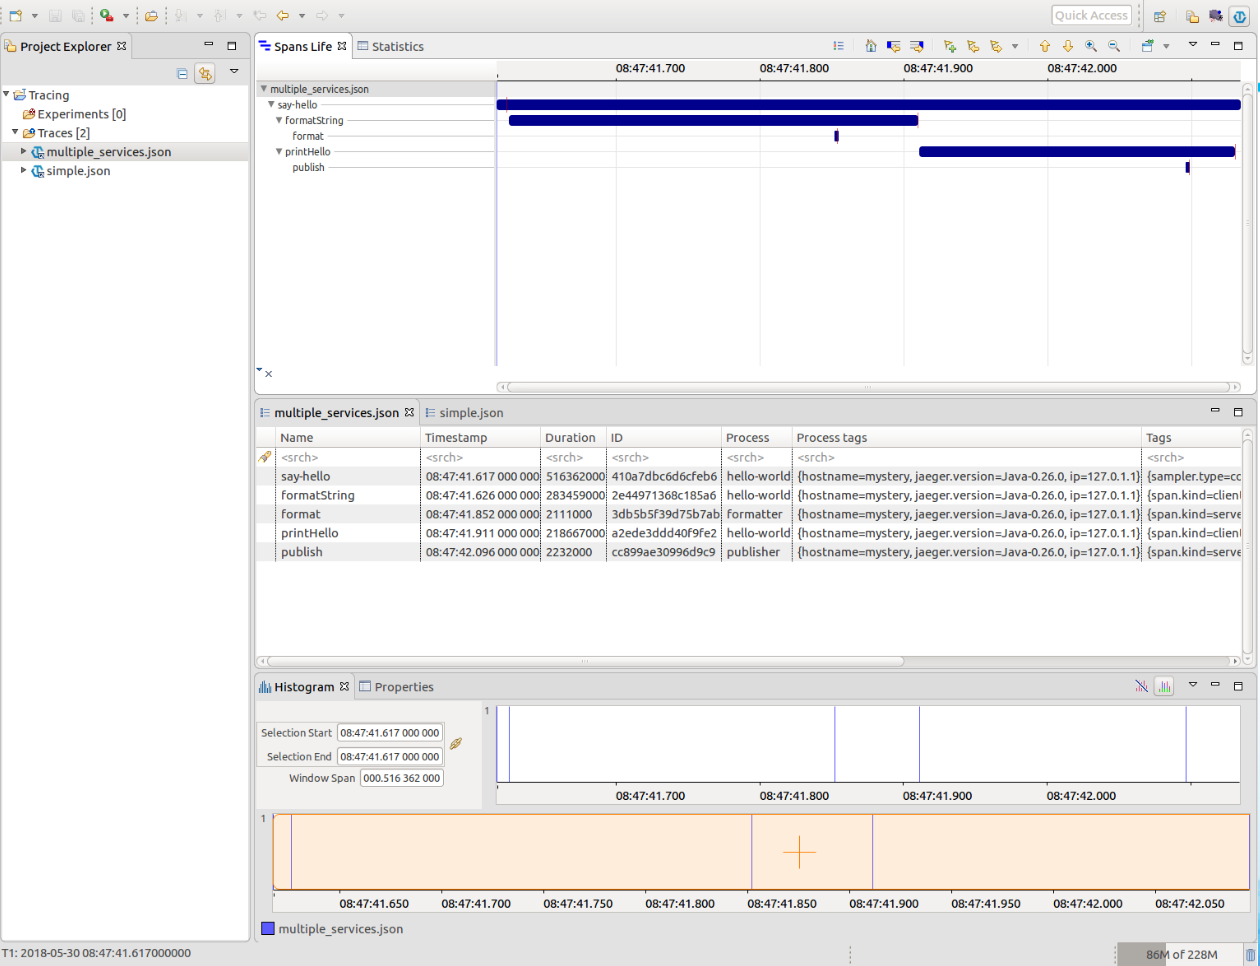
Open Tracing perspective contains:
- Project Explorer: List of your experiments as well as your traces
- Spans Life View: Time graph representation of the span's relationships
- Events Table: Information of every event as well as every span in the trace. Equivalent of the Jaeger "Spans List".
- Histogram: Overview of the spans occurences on a time basis
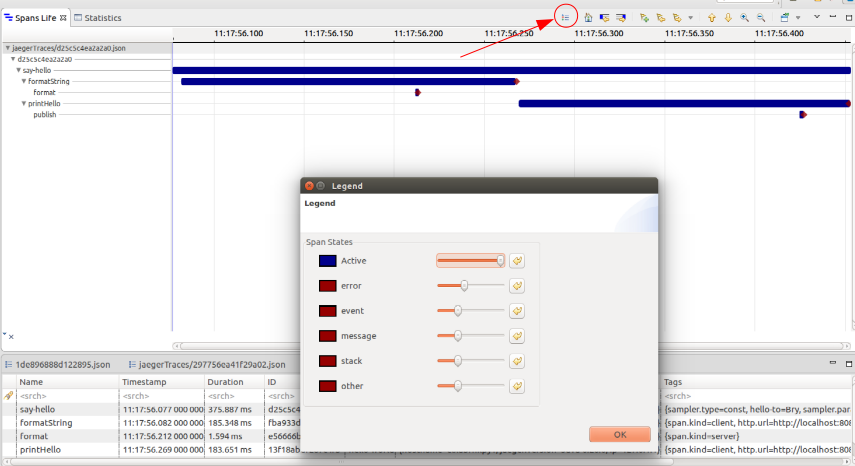
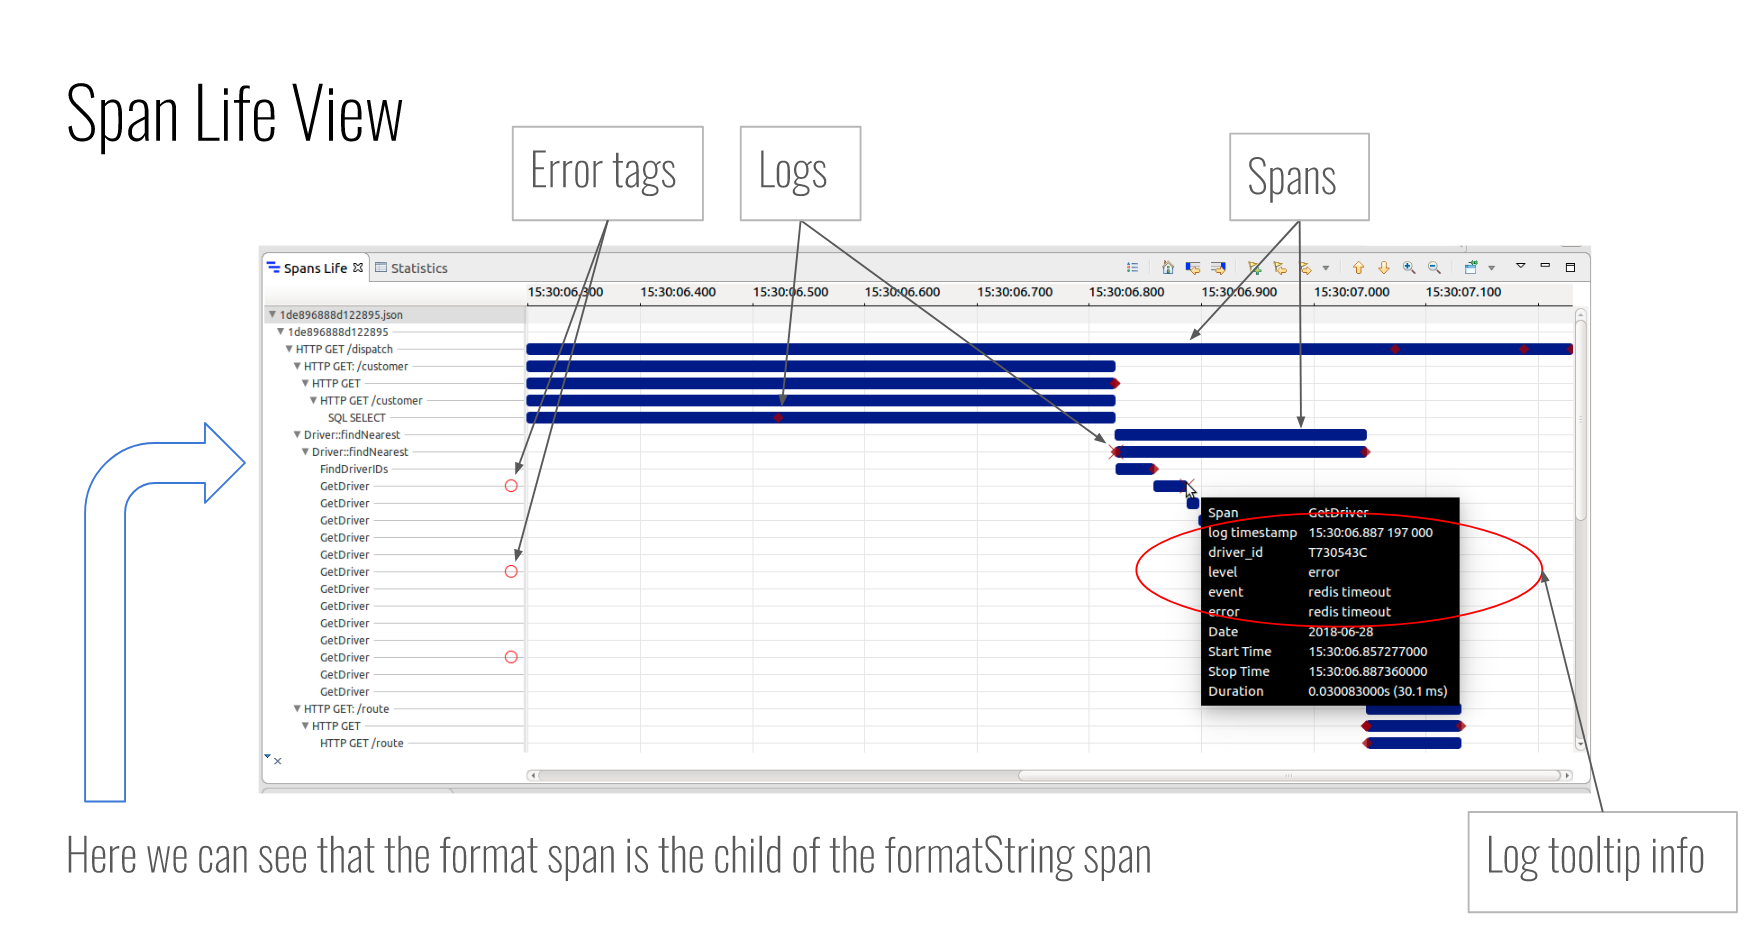
The main view is the Span Life view. It provides an overview of the spans. On the left of the view we can see the list of spans aggregated based on the child-parent relationships between the spans. You can also see a red circle next to some span name that represent an error tag. Different symbols are displayed on the spans where there are logs. Each symbol represent a certain type of log. For example, X's are errors. If you place your cursor over a log, you will have the information relative to this particular log.
You can access the legend via the legend button on top of the Span Life View. You have the possibility to change the color and the size of the different logs symbols.
