This feature applies to Linux perf traces converted to CTF using the perf builtin converter.
The perf trace is converted to CTF after having been recorded. The trace data is thus obtained by a normal perf record [argument] command. After the recording is finished, the perf.data file can be converted to CTF using the following command:
perf data convert --all --to-ctf ./ctf-data/
Where ./ctf-data/ is the folder in which the CTF files will be saved. The --all argument means ensures that events like mmap[2] are included in the trace. Those will allow to resolve the symbols to at least the library that contains them when reading the trace.
Note: Not all Linux distributions have the ctf conversion builtin. One needs to compile perf (thus linux) with environment variables LIBBABELTRACE=1 and LIBBABELTRACE_DIR=/path/to/libbabeltrace to enable that support.
To resolve the kernel symbols of the callchains and samples, the kernel symbols are needed. They can be obtained with the following command:
cat /proc/kallsyms > mykallsymsfile
Note that to avoid symbols with low addresses resolving to the default, the 00000000 lines should be removed from the kallsymsfile, that is usually the first 2 lines of the file.
The perf CTF trace can be obtained in Trace Compass, it should be recognized as a perf trace. If it is not, you can right-click on the trace and choose the Select trace type... -> Common Trace Format -> Perf 2 CTF trace menu item.
If the trace contains the scheduling/process/irq events, then all the views that applies to a kernel trace should be available (Control Flow View, Resources view, CPU Usage, etc)
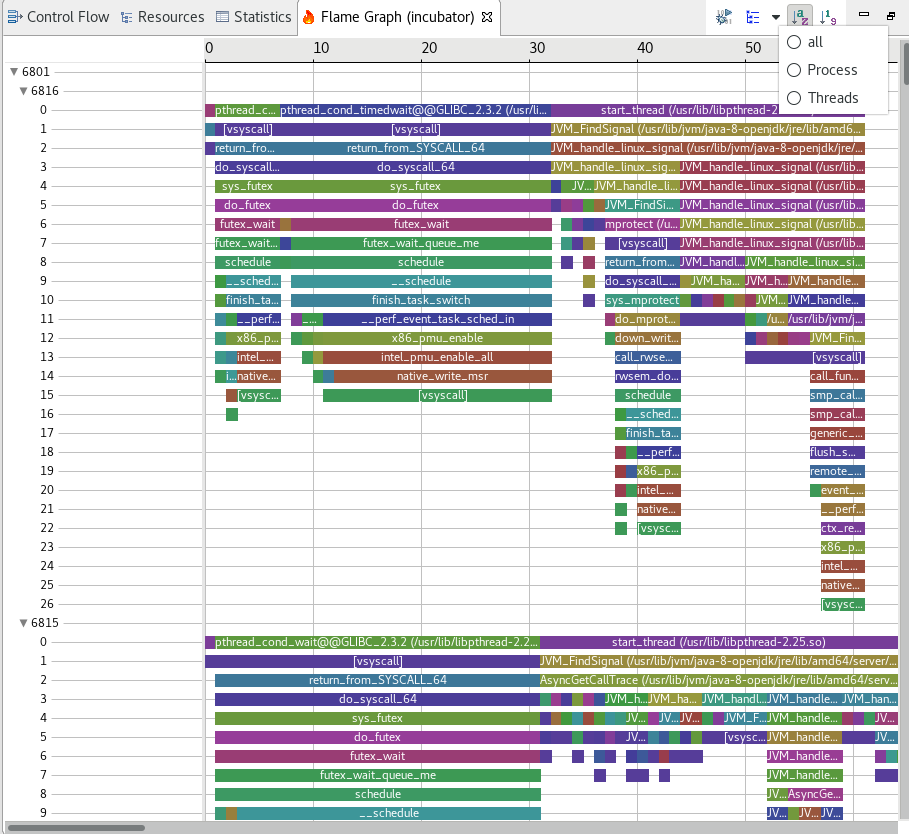
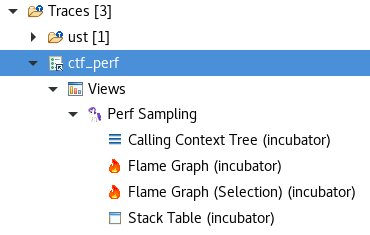
If the trace contains perf sampling events (event name contains cycles), then a flamegraph can be built for that trace. It is available under Perf sampling.
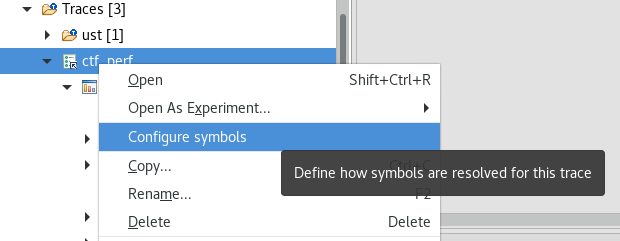
In order to have the symbol resolved to their names, the symbols in libraries should be available if the mmap[2] events are in the trace (the --all argument should have been used when converting). To resolve the kernel symbols, the mapping file should be added to the trace. By right-clicking the trace and selecting Configure symbols menu item, the symbol files can be added, ie the kallsyms file and any other file containing symbol mapping. For example, if tracing a java application with the perf-map-agent project, the .map file contains symbols that can be resolved.
The resulting flamegraph data is grouped by thread by default, but can also be grouped globally or per process.