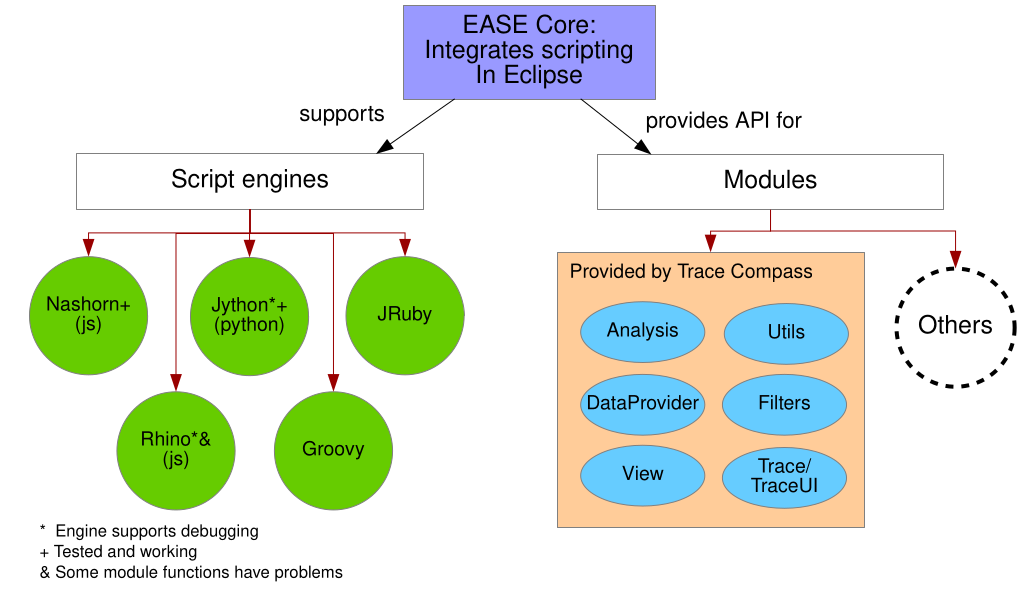
This plugin adds support for scripting in Trace Compass. It uses the Eclipse EASE project as the scripting framework. It supports python, javascript, ruby, groovy, among others.
The following image shows the Trace Compass EASE environment, with some comments on the various available scripting languages

To use Trace Compass Scripting modules, one needs to have the latest development snapshot of Trace Compass, or at least the stable 5.0 release.
The full installation procedure depends on the language one wishes to use for scripting. Here follows the details.
For Javascript, the feature is available through the Tools -> Add-ons... under the Analyses category. You can search for the Trace Compass Scripting Javascript (Incubation) feature and click ``Finish``.
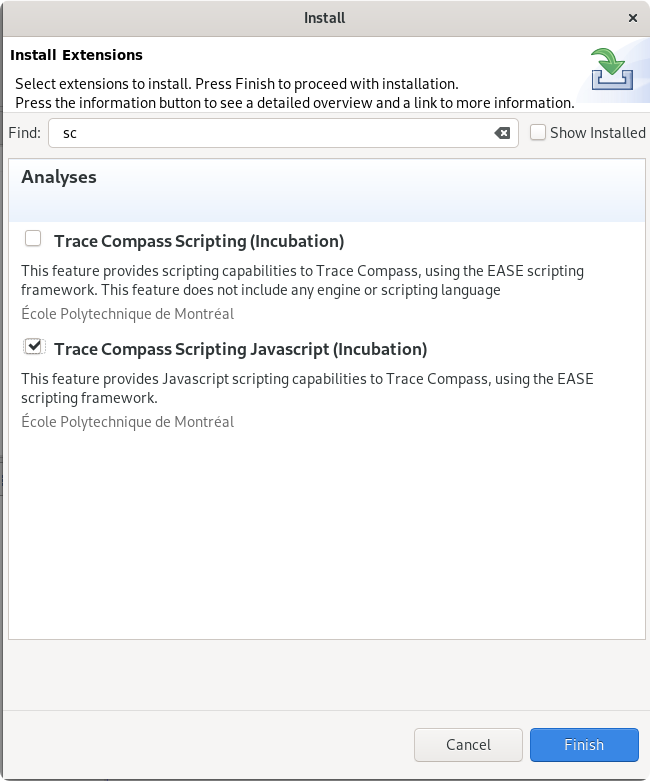
It will automatically install the required Trace Compass Scripting (Incubation) feature and all related features to edit and execute javascript with EASE.
After Trace Compass restart, the feature will be available.
For Python, the feature is also available through the Tools -> Add-ons... under the Analyses category. You can search for the Trace Compass Scripting Python (Incubation) feature and click ``Finish``.
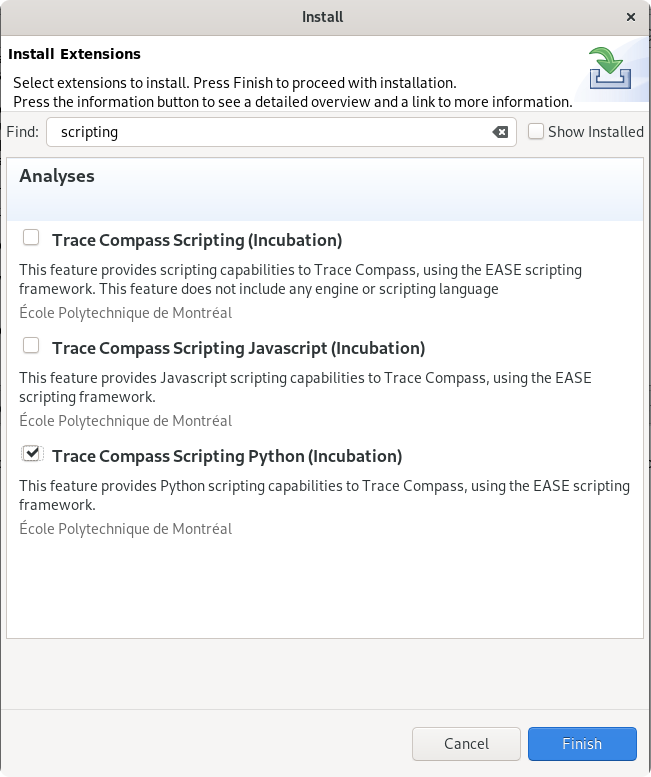
It will automatically install the required Trace Compass Scripting (Incubation) feature and all related features to execute python with EASE.
After Trace Compass restart, the feature will be available.
This feature does not come with any python code editors, so the python code file won't have code completion or syntax highlighting directly in Trace Compass. But an editor can be installed separately. One such editor is PyDev, which can be installed as an Eclipse plugin.
For any other language, there is some additional steps to install the full support.
First, you need to install the Trace Compass Scripting (Incubation) feature of Trace Compass through the Tools -> Add-ons.
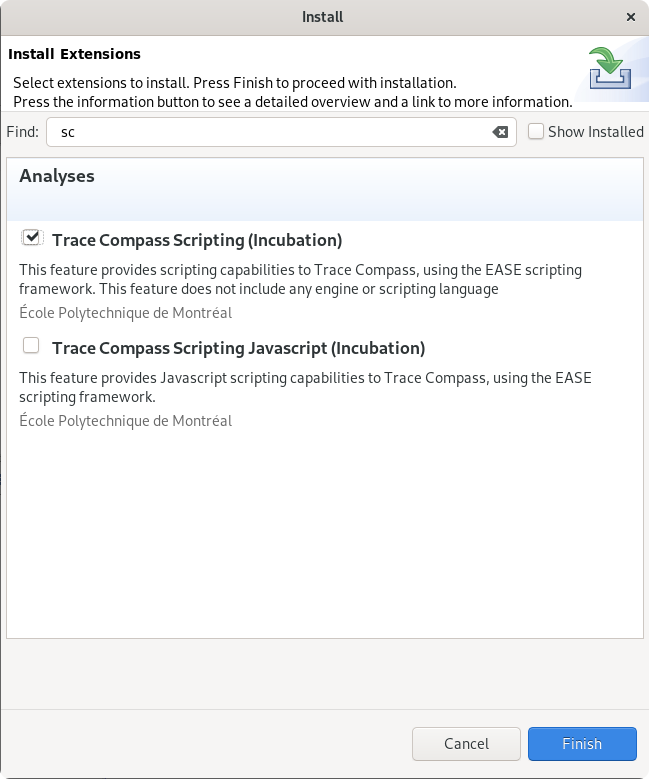
Then, for each language, one needs to install 2 components:
Here is the EASE page describing the supported engines/editors
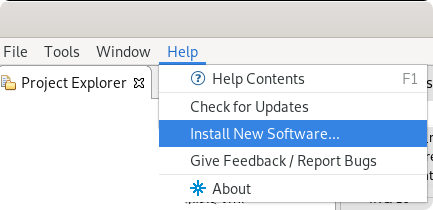
To install the EASE language support, go to the Help -> Install New Software... menu. From the list of available update site, select the ease update site. It should be already available after installing the Trace Compass feature. In case it is not, you can add it using the following link http://download.eclipse.org/ease/update/release.
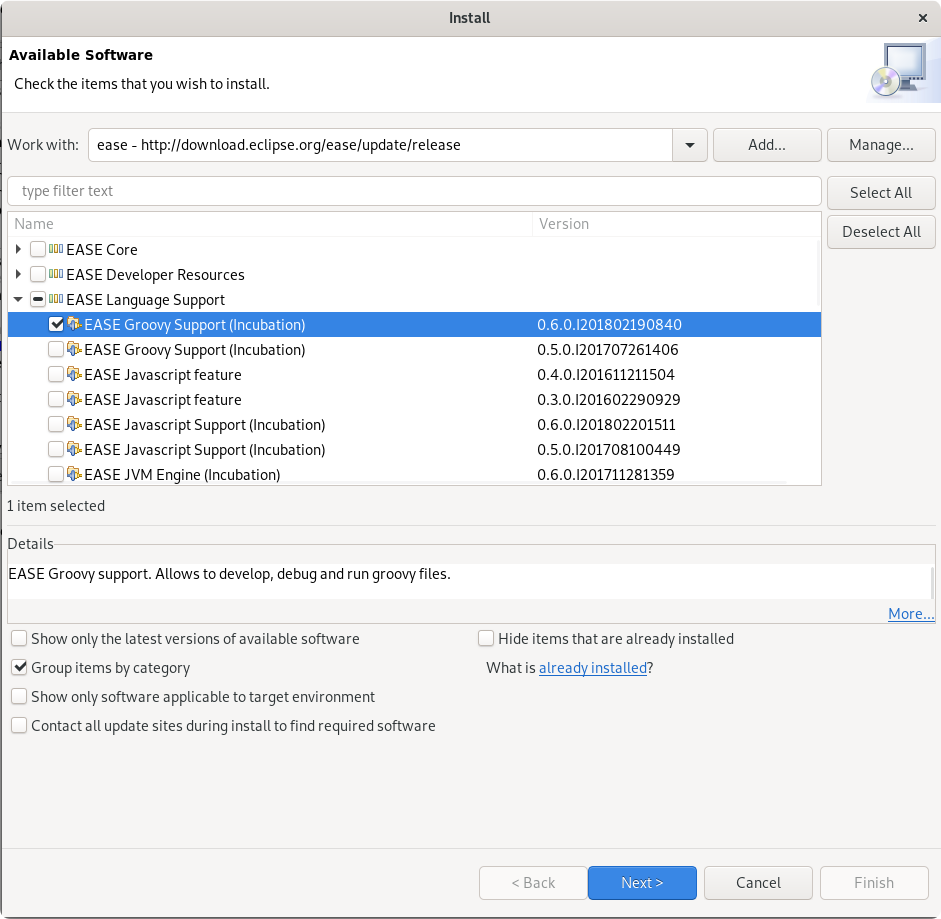
Then under the EASE Language Support category, select the appropriate feature. There are some duplicates, you should look at the Version of the feature, it should be the latest one (0.6.0.x). For instance, to add groovy support, you need to select the EASE Groovy Support (Incubation). Then complete the installation.
If an editor is not installed, the script files will be opened in an external text editor instead of in Trace Compass. That may be sufficient for small scripts, but having code completion, etc can be handy too. Follow the links in the the supported engines/editors page for the appropriate engine and follow the instructions to install its editor in Eclipse. They are external tools and sometimes, IDEs of their own, so they might add a lot of content and dependencies to Trace Compass.
Trace Compass scripts are not associated with a trace or trace type, do not integrate well with the analysis framework, so you will not see any scripted views under a trace. A script needs to be run manually for each trace and it will run on the currently active trace.
Anywhere in Trace Compass workspace, you can create a script file. For example, right-click on a project, the select New -> File and name it <some-file-name>.js.
The file should now open in a javascript editor in Trace Compass. You can write your script in that file. The next sections describes the API to Trace Compass and show an example script.

To run the script, make sure the trace you want to run it on is active, then, right-click on the script and select Run As -> EASE Script.
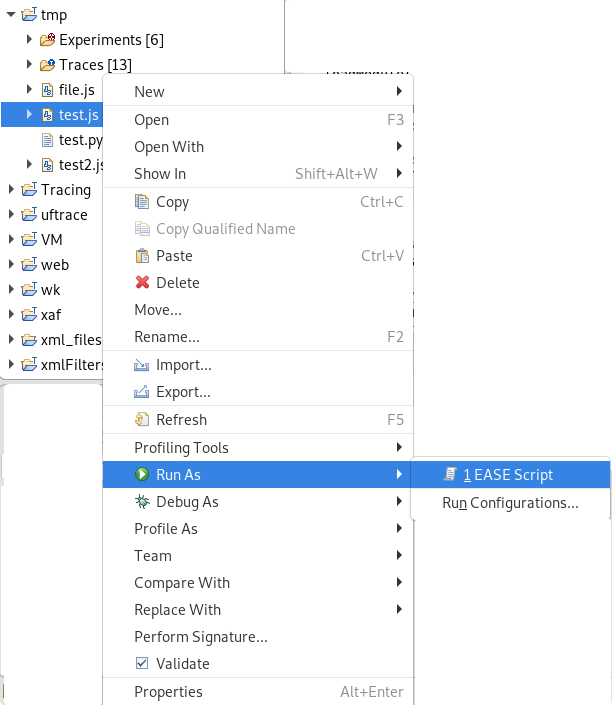
You can also run the script in debug mode ( Debug As -> EASE Script). Also, any print statement in the script will be displayed in the Console that opens when the script is run.
The Trace Compass branch downloaded above changed the State System Explorer so that it can open state system files directly, without requiring them to be linked to an analysis. The state system created by the script can thus be explored using that view.
Change the Javascript engine to Nashorn in the Run configuration..., as in the screenshot below.
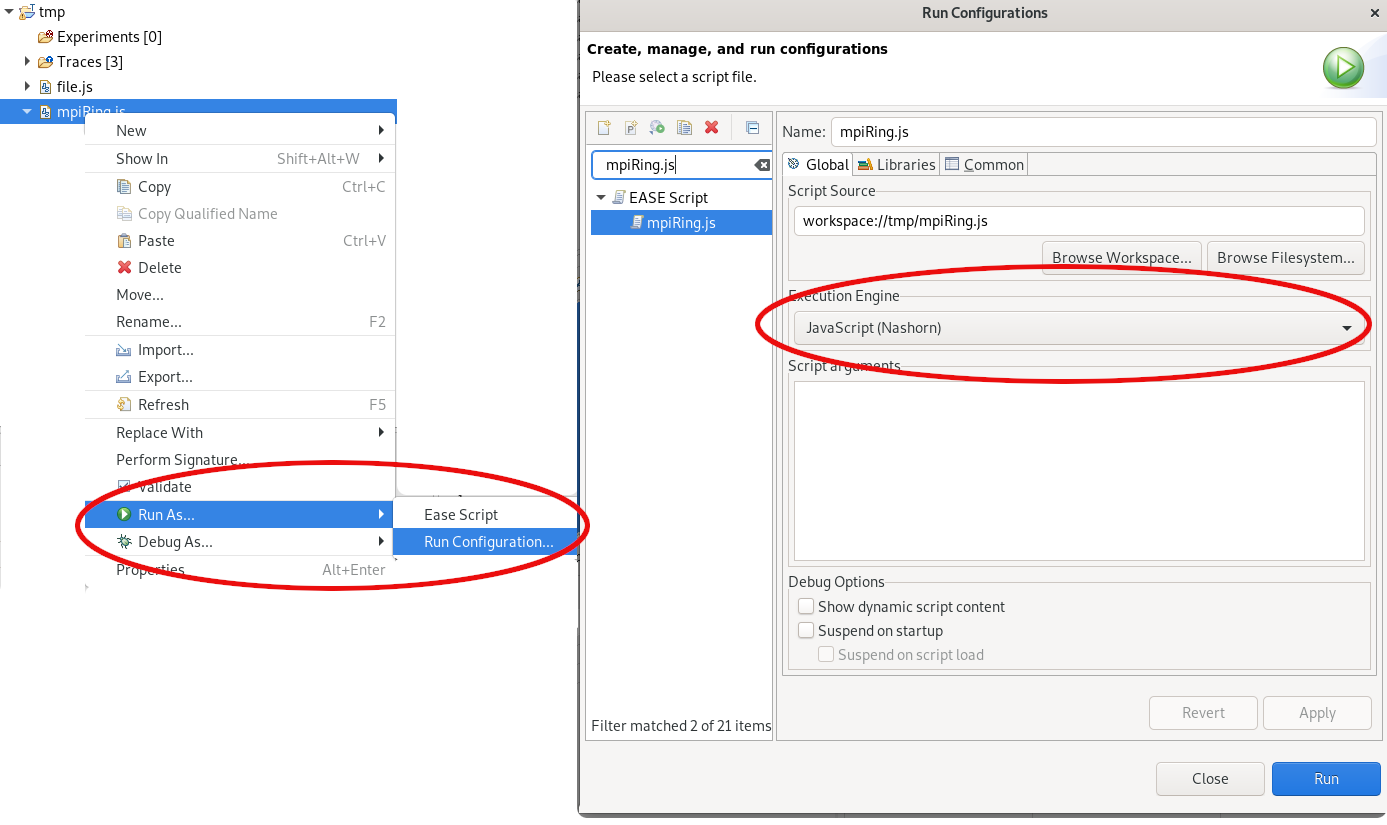
Explanation: This will typically happen when calling a method with multiple signatures. There are 2 javascript engines in EASE:
1. Rhino which has the advantage of having a debug engine, but does not handle well methods with multiple signature.
2. Nashorn which lacks a debugger but has better support of jave methods with multiple signatures.
So when problems that should not be arise with Rhino, a switch to Nashorn may fix the problem.
To avoid OutOfMemoryException, objects should be explicitly detached from the py4j gateway when not needed anymore by calling gateway.detach(myUnneededObject).
Explanation: The python java gateway keeps a reference to the Java objects it sends to the python side. In theory, those objects should be released when the python garbage collector runs. But in practice, it does not seem to work very well, and for scripts that creates a lot of objects (like an event request on a large trace), an OOME happens.
See the py4j memory model documentation for more information.
Some views that come with the EASE framework can be helpful for Trace Compass scripting users. Here's a short description of those views.
Apart from executing a script file, it is also possible to access a script shell in Trace Compass, and script commands from it.
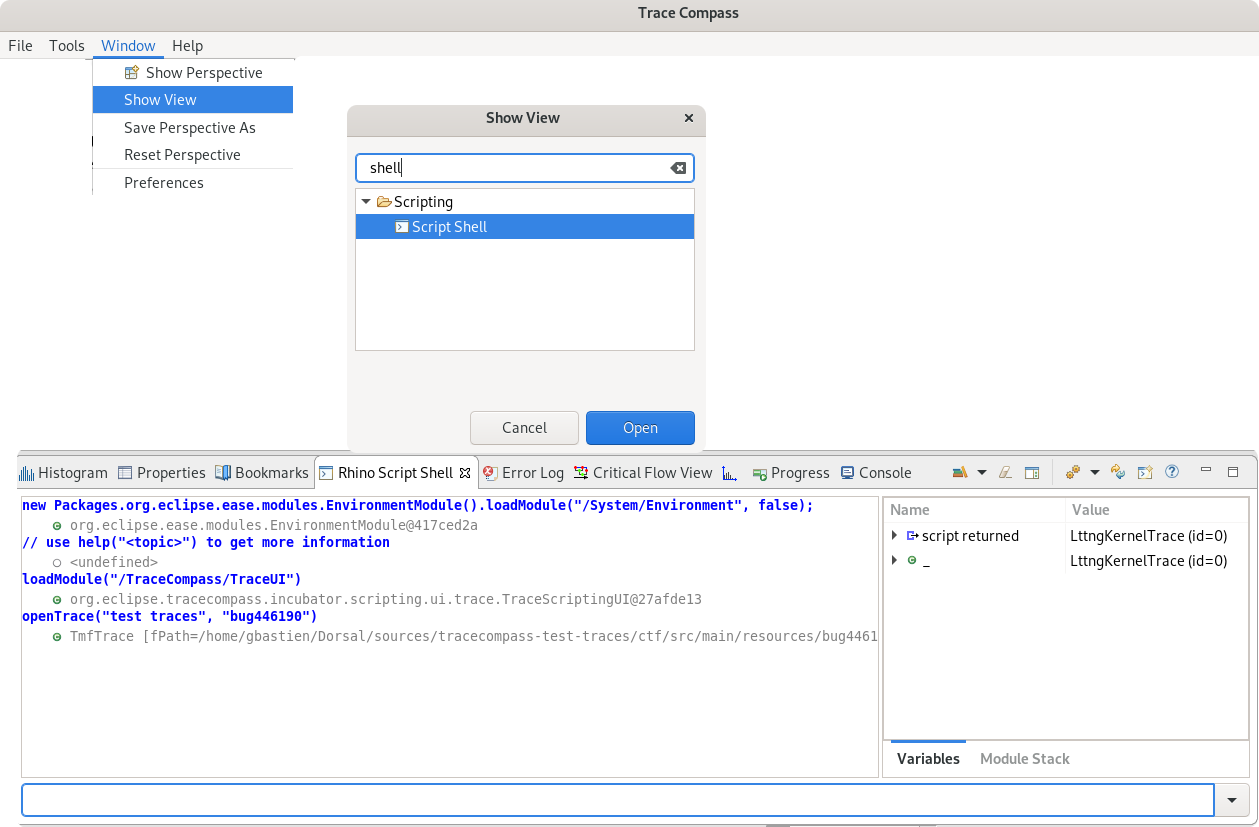
To do so, open the Script Shell view, using Window -> Show View and selecting Script Shell under the Scripting category. It will open a shell for the given scripting language, as shown in the screenshot below, where the view is called Rhino Script Shell.
From this shell, commands can load modules, then execute methods from this modules, in the screenshot, the /TraceCompass/TraceUI module was loaded and a trace opened directly from command line.
The Module Explorer view can be accessed via Window -> Show View and selecting Module Explorer under the Scripting category. It will open a window where the available scripting modules are listed.
Under each scripting module is the list of constants and methods available to the scripts. Some help text is also available when hovering over the elements.
The modules are grouped by category and to use the methods under them, one simply needs to load the module first, using loadModule("/<category name>/<module name>"). Then the fields and methods can be used directly in the script

The Script Explorer view is available only with the Javascript language installed, but allows to see all scripts. It is not as useful as the others, it is very similar to the main Project Explorer view, but more focused on scripts. Menu items on script files may be different from those of a Tracing project, for example, opening the file in an editor works through that view.
The view can be accessed via Window -> Show View and selecting Script Explorer under the Javascript category.

The scripting modules and API are documented in the Scripting section of the Trace Compass Incubator API documentation. Many examples are also available in this github repository. You can contribute your own examples there.
Here's an example javascript script for Trace Compass. It is the equivalent of Active Thread analysis in Trace Compass, ie saves the currently running process on each CPU.
// load Trace Compass modules
loadModule('/TraceCompass/Analysis');
loadModule('/TraceCompass/DataProvider');
loadModule('/TraceCompass/Trace');
loadModule('/TraceCompass/View');

// Get the active trace
var trace = getActiveTrace();

// Create an analysis named activetid.js
var analysis = createScriptedAnalysis(trace, "activetid.js");

if (analysis == null) {
	print("Trace is null");
	exit();
}

// Get the analysis's state system so we can fill it, false indicates to create a new state system even if one already exists, true would re-use an existing state system
var ss = analysis.getStateSystem(false);

// The analysis itself is in this function
function runAnalysis() {
	// Get the event iterator for the trace
	var iter = analysis.getEventIterator();

	var event = null;
	// Parse all events
	while (iter.hasNext()) {

		event = iter.next();

		// Do something when the event is a sched_switch
		if (event.getName() == "sched_switch") {
			// This function is a wrapper to get the value of field CPU in the event, or return null if the field is not present
			cpu = getEventFieldValue(event, "CPU");
			tid = getEventFieldValue(event, "next_tid");
			if ((cpu != null) && (tid != null)) {
				// Write the tid to the state system, for the attribute corresponding to the cpu
				quark = ss.getQuarkAbsoluteAndAdd(cpu);
				// modify the value, tid is a long, so "" + tid make sure it's a string for display purposes
				ss.modifyAttribute(event.getTimestamp().toNanos(), "" + tid, quark);
			}
		}

	}
	// Done parsing the events, close the state system at the time of the last event, it needs to be done manually otherwise the state system will still be waiting for values and will not be considered finished building
	if (event != null) {
		ss.closeHistory(event.getTimestamp().toNanos());
	}
}

// This condition verifies if the state system is completed. For instance, if it had been built in a previous run of the script, it wouldn't run again.
if (!ss.waitUntilBuilt(0)) {
	// State system not built, run the analysis
	runAnalysis();
}

function getEntries(filter) {
	quarks = ss.getQuarks("*");
	// Prepare the CPU names and sort them
	var cpus = [];
	for (i = 0; i < quarks.size(); i++) {
		quark = quarks.get(i);
		cpus.push(ss.getAttributeName(quark));
	}
	cpus.sort(function(a,b){return Number(a) - Number(b)});
	var entries = [];
	for (i = 0; i < cpus.length; i++) {
		cpu = cpus[i];
		quark = ss.getQuarkAbsolute(cpu);
		entries.push(createEntry({'quark' : quark, 'name' : "CPU " + cpu}));
	}
	return entries;
}

// Get a time graph provider from this analysis, displaying all attributes (which are the cpus here)
provider = createTimeGraphProvider(analysis, {'path' : '*'});
if (provider != null) {
	// Open a time graph view displaying this provider
	openTimeGraphView(provider);
}

print("Done");
It is possible to call other scripts files from a running script. The script to call can be referred to either by its full path in the file system, or by its path in the workspace, using teh following URI: workspace://<Project name>/<path to file in project>.
There are 2 different approaches:
This approach will include the file in the currently running context, so the file has to be in the same language as the running script. The file's content will be executed upon inclusion, so make sure it is OK. It is ideal for function libraries, etc.
For example, let's say I have the following javascript file library.js:
function sum(a, b){
   return a+b;
}
I can call it from another script caller.js:
include("workspace:/MyProject/library.js")
print(sum(2,3));
It is also possible to fork a script. The new script will be executed in its own context, will not be available to the running script, but it can be of any language, not just the one of the running script.
Forking a script requires additional EASE Modules that do not come with the Trace Compass EASE Scripting feature.
First, the user needs to install the JDT Plugin-in Developer Resources from the Eclipse Project Update Site that corresponds to your release of Trace Compass. Enter the update site's URL in the Help -> Install New Software.... wizard, in the Work with box. The feature is under the Eclipse Java Development Tools category. Restart Trace Compass after installation.
Then install the EASE Modules feature from the EASE update site. It is under the EASE Modules category. Complete the wizard then restart Trace Compass.
This adds some System modules to Trace Compass. We can then call other scripts from a script. For instance the following snippet is a Javascript script called caller.js, that runs a python script with 3 arguments and wait for its completion before continuing:
loadModule("/System/Scripting");

res = fork("workspace://MyProject/callee.py", "a,b,c");
res.waitForResult();
The following python script callee.py simply prints the arguments received:
print('Number of arguments: {} arguments.'.format(len(argv)))

for myArg in argv:
	print("Argument {}".format(myArg))
It is possible to pass String arguments to scripts. These arguments are stored in the
argv variable of the script, that is directly available (no sys.argv in python scripts for instance, it's directly argv).
For example, in javascript, here's the code that will print the arguments received in parameter:
for (i = 0; i< argv.length; i++) {
	print(argv[i])
}
Arguments can be passed directly in the launch configuration of the script, by right-clicking the script, Run As... -> Run Configuration.... In the Script arguments box, the arguments are comma-separated strings. The below image shows passing 2 arguments arg1 and arg2' to the library.js script.
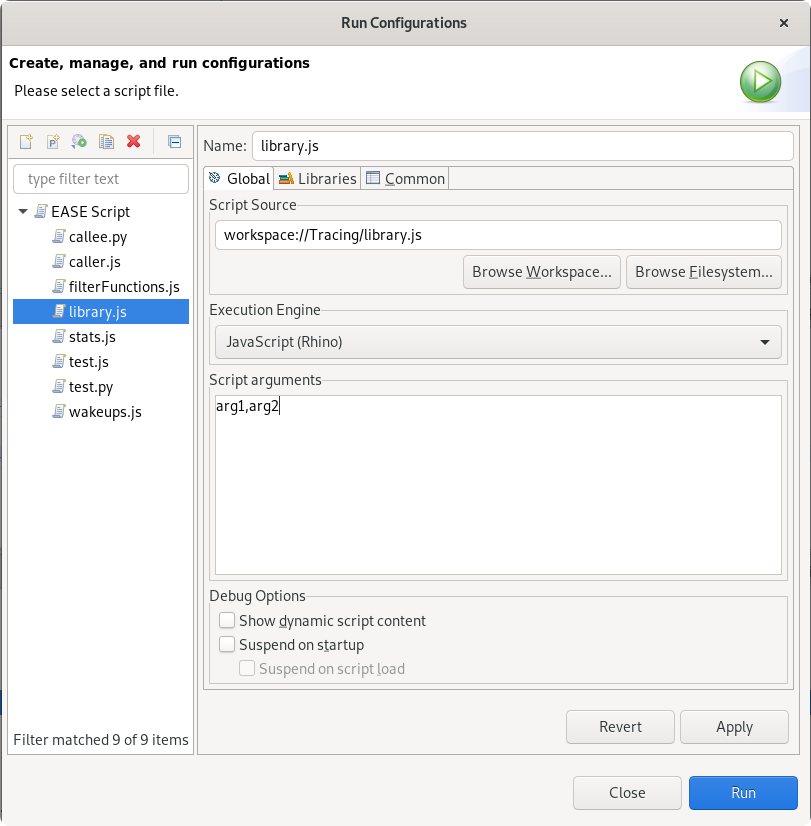
If calling a script from another script as explained in
the section above, the arguments can be passed through the fork, like this: fork("workspace:/Tracing/library.js", "a,b,c");, that would pass 3 arguments
a,
b and
c to the
library.js script.
Chat with the Trace Compass community on the IRC channel (the `#tracecompass` channel on the OFTC network) or contact the Trace Compass mailing list.
Request a feature for it or develop it in the Trace Compass Incubator project (org.eclipse.tracecompass.incubator.scripting.*) and contribute it through GitHub.
Report it, attaching the script and trace that caused it.