
| Latency Analyses | ||
|---|---|---|

|

|
|
| Data driven analysis | Counters Analysis | |
Trace Compass offers a feature called Latency analysis. This allows an analysis to return intervals and these intervals will be displayed in four different views. An example analysis is provided with kernel system call latencies being provided. The available views are:
A table of the raw latencies. This view is useful to inspect individual latencies.
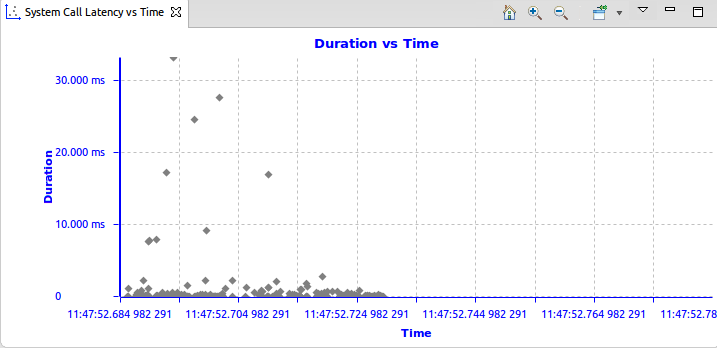
A time aligned scatter chart of the latencies with respect to the current window range. This view is useful to see the overall form of the latencies as they arrive.

For navigation, see CPU Usage view's Using the mouse , Using the keyboard and Zoom region .
For the toolbar, see CPU Usage view's Toolbar .'
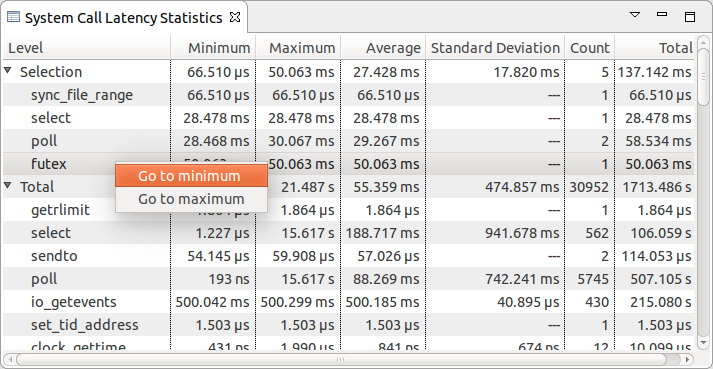
A view of the statistics of the latencies. These show the minimum, maximum, average, standard deviation, count and Total of the latencies when applicable. The view shows the total statistics for the whole trace also as the local statistics for a selection range. This tool is useful for finding the outliers on a per-category basis.
Right-clicking on an entry of the table and select Go to minimum allows to select the range of the minimum latency for the selected entry and synchronize the other views to this time range.
Right-clicking on an entry of the table and select Go to maximum allows to select the range of the maximum latency for the selected entry and synchronize the other views to this time range.

A density view, analyzing the current time range. This is useful to find global outliers. Selecting a duration in the table it will synchronize other views to this time range.

Using the right mouse button to drag horizontally it will update the table and graph to show only the density for the selected durations. Durations outside the selection range will be filtered out. Using the toolbar button
 the zoom range will be reset.

|

|

|
| Data driven analysis | Counters Analysis |