

| View Tutorial | ||
|---|---|---|
|
|
|
|
| Implementing a New Trace Type | Component Interaction | |
This tutorial describes how to create a simple view using the TMF framework and the SWTChart library. SWTChart is a library based on SWT that can draw several types of charts including a line chart which we will use in this tutorial. We will create a view containing a line chart that displays time stamps on the X axis and the corresponding event values on the Y axis.
This tutorial will cover concepts like:
Note: Trace Compass 0.1.0 provides base implementations for generating SWTChart viewers and views. For more details please refer to chapter TMF Built-in Views and Viewers.
The tutorial is based on Eclipse 4.4 (Eclipse Luna), Trace Compass 0.1.0 and SWTChart 0.7.0. If you are using TMF from the source repository, SWTChart is already included in the target definition file (see org.eclipse.tracecompass.target). You can also install it manually by using the Orbit update site. http://download.eclipse.org/tools/orbit/downloads/
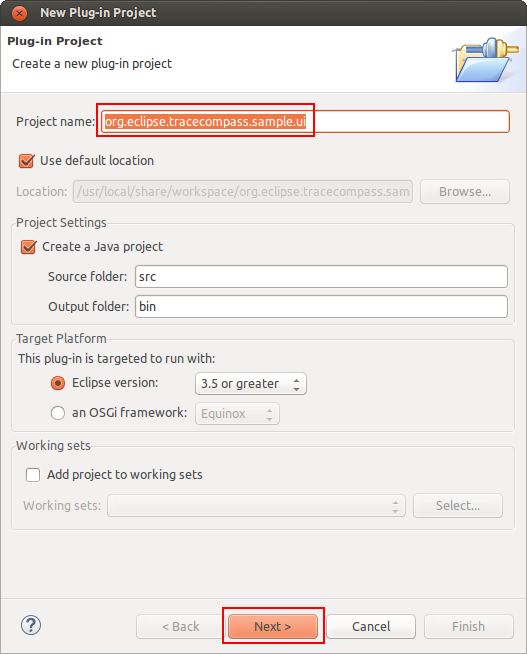
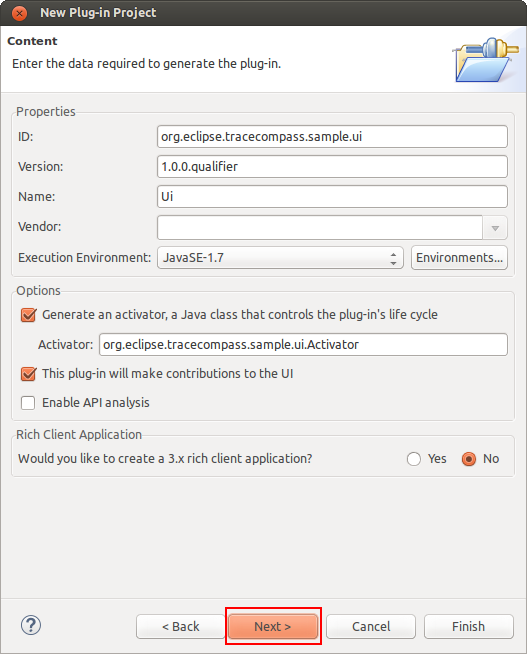
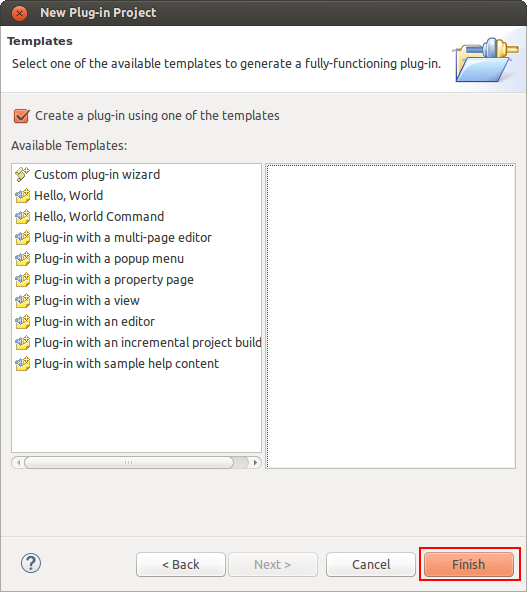
To create a new project with name org.eclipse.tracecompass.tmf.sample.ui select
File -> New -> Project -> Plug-in Development -> Plug-in Project.
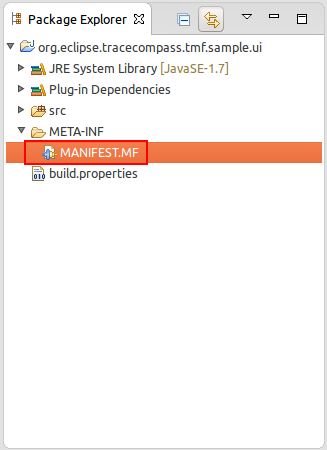
To open the plug-in manifest, double-click on the MANIFEST.MF file.
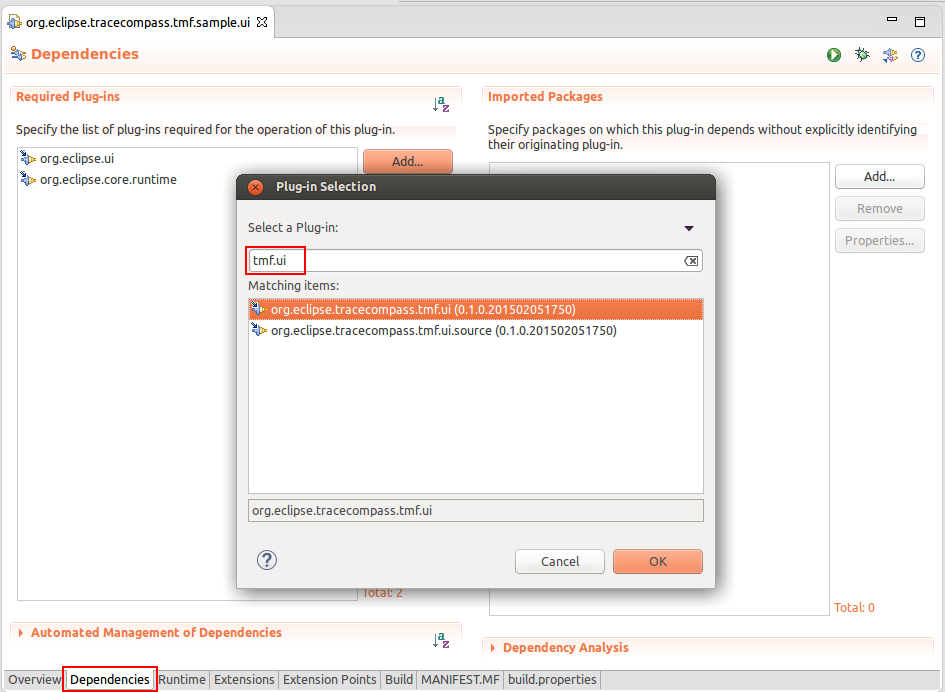
Change to the Dependencies tab and select
Add... of the
Required Plug-ins section. A new dialog box will open. Next find plug-in
org.eclipse.tracecompass.tmf.core and press
OK
Following the same steps, add
org.eclipse.tracecompass.tmf.ui and
org.exlipse.swtchart.
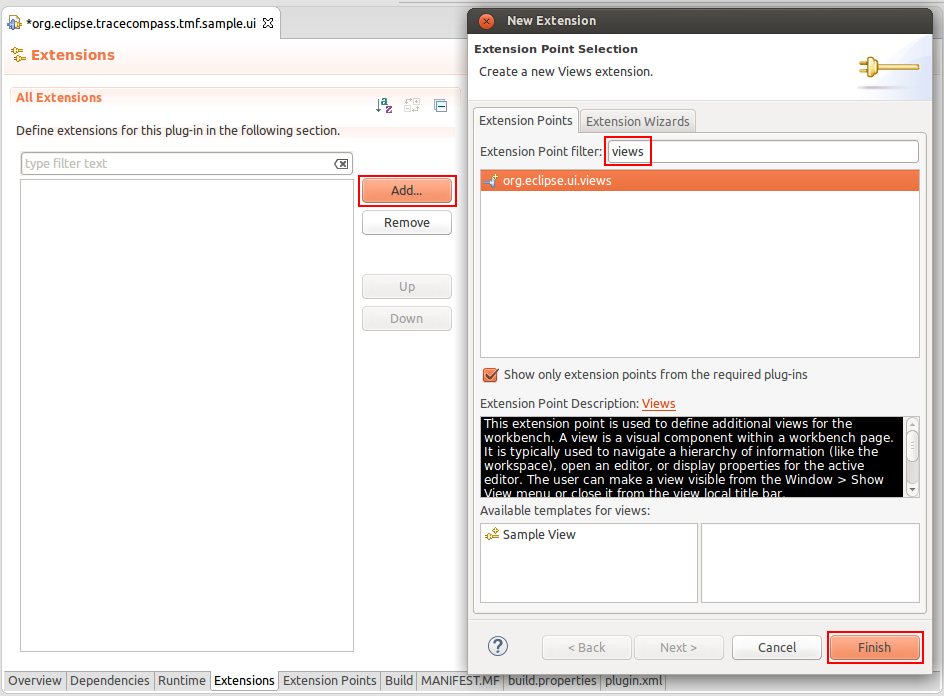
Change to the Extensions tab and select
Add... of the
All Extension section. A new dialog box will open. Find the view extension
org.eclipse.ui.views and press
Finish.
To create a view, click the right mouse button. Then select
New -> view
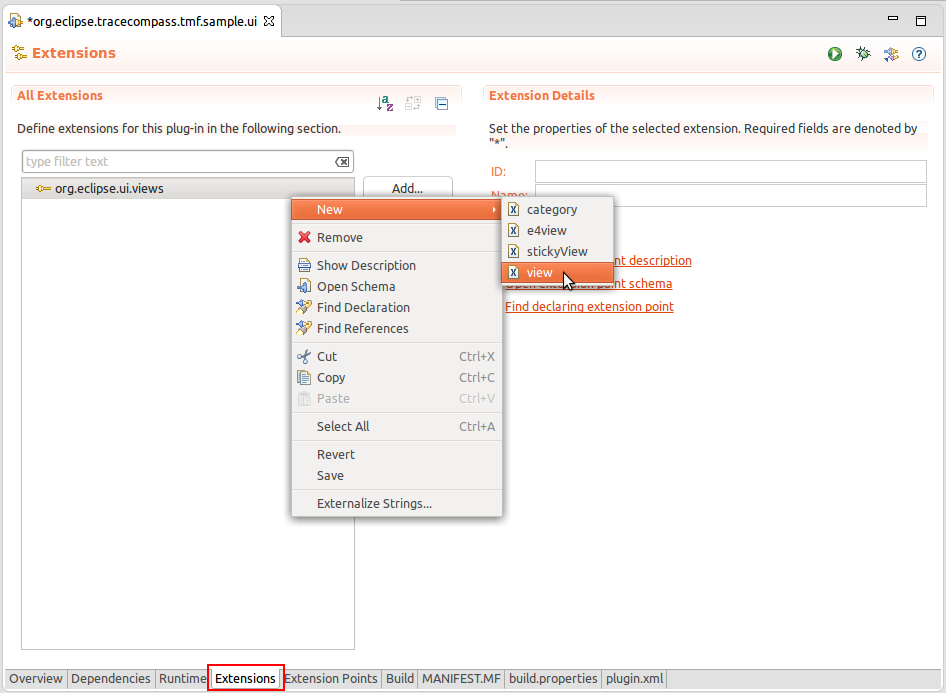
A new view entry has been created. Fill in the fields
id and
name. For
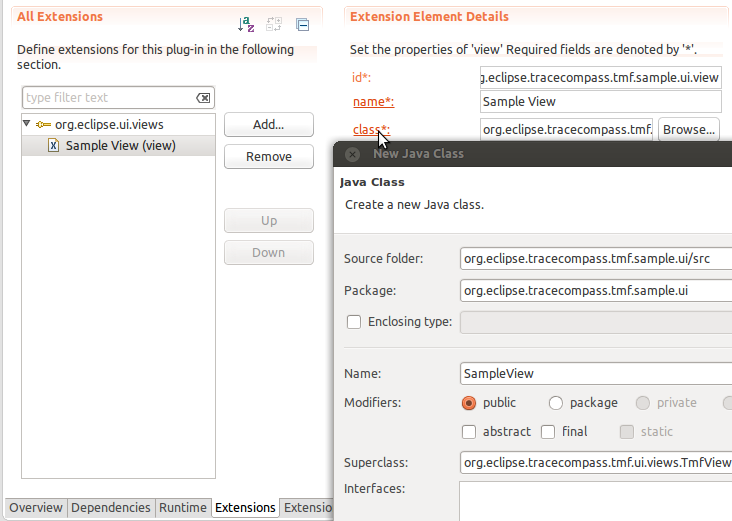
class click on the
class hyperlink and it will show the New Java Class dialog. Enter the name
SampleView, change the superclass to
TmfView and click Finish. This will create the source file and fill the
class field in the process. We use TmfView as the superclass because it provides extra functionality like getting the active trace, pinning and it has support for signal handling between components.
This will generate an empty class. Once the quick fixes are applied, the following code is obtained:
package org.eclipse.tracecompass.tmf.sample.ui;

import org.eclipse.swt.widgets.Composite;
import org.eclipse.ui.part.ViewPart;

public class SampleView extends TmfView {

    public SampleView(String viewName) {
        super(viewName);
        // TODO Auto-generated constructor stub
    }

    @Override
    public void createPartControl(Composite parent) {
        // TODO Auto-generated method stub

    }

    @Override
    public void setFocus() {
        // TODO Auto-generated method stub

    }

}
This creates an empty view, however the basic structure is now is place.
We will start by adding a empty chart then it will need to be populated with the trace data. Finally, we will make the chart more visually pleasing by adjusting the range and formating the time stamps.
First, we can add an empty chart to the view and initialize some of its components.
    private static final String SERIES_NAME = "Series";
    private static final String Y_AXIS_TITLE = "Signal";
    private static final String X_AXIS_TITLE = "Time";
    private static final String FIELD = "value"; // The name of the field that we want to display on the Y axis
    private static final String VIEW_ID = "org.eclipse.tracecompass.tmf.sample.ui.view";
    private Chart chart;
    private ITmfTrace currentTrace;

    public SampleView() {
        super(VIEW_ID);
    }

    @Override
    public void createPartControl(Composite parent) {
        chart = new Chart(parent, SWT.BORDER);
        chart.getTitle().setVisible(false);
        chart.getAxisSet().getXAxis(0).getTitle().setText(X_AXIS_TITLE);
        chart.getAxisSet().getYAxis(0).getTitle().setText(Y_AXIS_TITLE);
        chart.getSeriesSet().createSeries(SeriesType.LINE, SERIES_NAME);
        chart.getLegend().setVisible(false);
    }

    @Override
    public void setFocus() {
        chart.setFocus();
    }
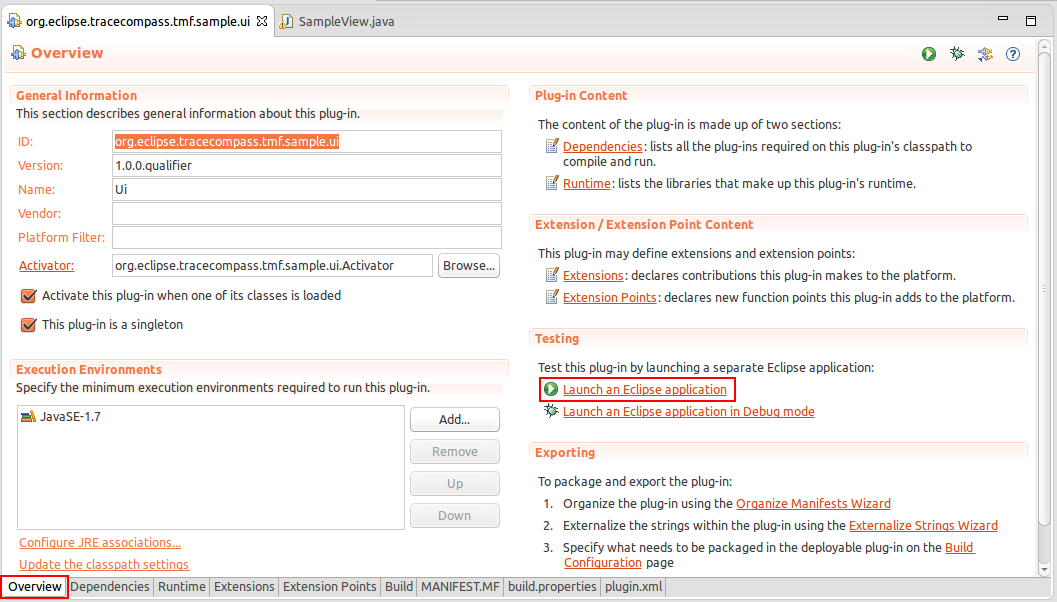
The view is prepared. Run the Example. To launch the an Eclipse Application select the
Overview tab and click on
Launch an Eclipse Application
A new Eclipse application window will show. In the new window go to
Windows -> Show View -> Other... -> Other -> Sample View.
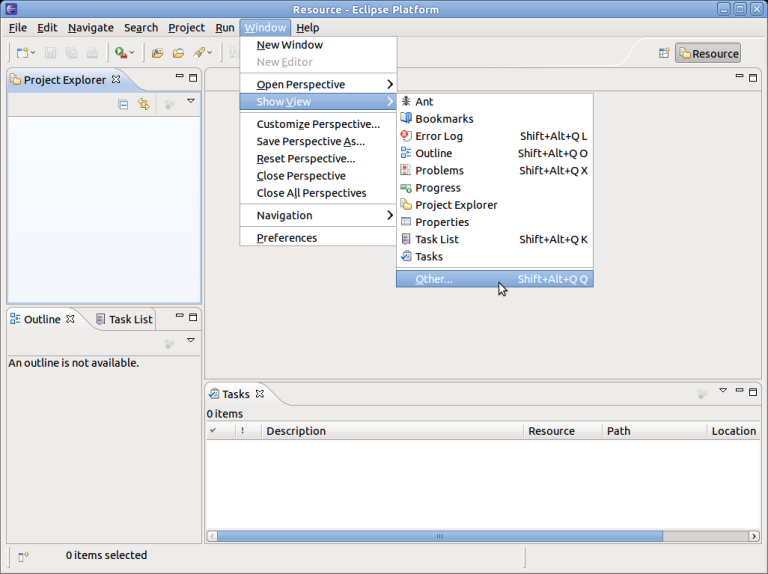
You should now see a view containing an empty chart
![]()
We would like to populate the view when a trace is selected. To achieve this, we can use a signal hander which is specified with the @TmfSignalHandler annotation.
    @TmfSignalHandler
    public void traceSelected(final TmfTraceSelectedSignal signal) {

    }
Then we need to actually gather data from the trace. This is done asynchronously using a TmfEventRequest
    @TmfSignalHandler
    public void traceSelected(final TmfTraceSelectedSignal signal) {
        // Don't populate the view again if we're already showing this trace
        if (currentTrace == signal.getTrace()) {
            return;
        }
        currentTrace = signal.getTrace();

        // Create the request to get data from the trace

        TmfEventRequest req = new TmfEventRequest(TmfEvent.class,
                TmfTimeRange.ETERNITY, 0, ITmfEventRequest.ALL_DATA,
                ITmfEventRequest.ExecutionType.BACKGROUND) {

            @Override
            public void handleData(ITmfEvent data) {
                // Called for each event
                super.handleData(data);
            }

            @Override
            public void handleSuccess() {
                // Request successful, not more data available
                super.handleSuccess();
            }

            @Override
            public void handleFailure() {
                // Request failed, not more data available
                super.handleFailure();
            }
        };
        ITmfTrace trace = signal.getTrace();
        trace.sendRequest(req);
    }
The chart expects an array of doubles for both the X and Y axis values. To provide that, we can accumulate each event's time and value in their respective list then convert the list to arrays when all events are processed.
        TmfEventRequest req = new TmfEventRequest(TmfEvent.class,
                TmfTimeRange.ETERNITY, 0, ITmfEventRequest.ALL_DATA,
                ITmfEventRequest.ExecutionType.BACKGROUND) {

            ArrayList<Double> xValues = new ArrayList<Double>();
            ArrayList<Double> yValues = new ArrayList<Double>();

            @Override
            public void handleData(ITmfEvent data) {
                // Called for each event
                super.handleData(data);
                ITmfEventField field = data.getContent().getField(FIELD);
                if (field != null) {
                    yValues.add((Double) field.getValue());
                    xValues.add((double) data.getTimestamp().getValue());
                }
            }

            @Override
            public void handleSuccess() {
                // Request successful, not more data available
                super.handleSuccess();

                final double x[] = toArray(xValues);
                final double y[] = toArray(yValues);

                // This part needs to run on the UI thread since it updates the chart SWT control
                Display.getDefault().asyncExec(new Runnable() {

                    @Override
                    public void run() {
                        chart.getSeriesSet().getSeries()[0].setXSeries(x);
                        chart.getSeriesSet().getSeries()[0].setYSeries(y);

                        chart.redraw();
                    }

                });
            }

            /**
             * Convert List<Double> to double[]
             */
            private double[] toArray(List<Double> list) {
                double[] d = new double[list.size()];
                for (int i = 0; i < list.size(); ++i) {
                    d[i] = list.get(i);
                }

                return d;
            }
        };
The chart now contains values but they might be out of range and not visible. We can adjust the range of each axis by computing the minimum and maximum values as we add events.
            ArrayList<Double> xValues = new ArrayList<Double>();
            ArrayList<Double> yValues = new ArrayList<Double>();
            private double maxY = -Double.MAX_VALUE;
            private double minY = Double.MAX_VALUE;
            private double maxX = -Double.MAX_VALUE;
            private double minX = Double.MAX_VALUE;

            @Override
            public void handleData(ITmfEvent data) {
                super.handleData(data);
                ITmfEventField field = data.getContent().getField(FIELD);
                if (field != null) {
                    Double yValue = (Double) field.getValue();
                    minY = Math.min(minY, yValue);
                    maxY = Math.max(maxY, yValue);
                    yValues.add(yValue);

                    double xValue = (double) data.getTimestamp().getValue();
                    xValues.add(xValue);
                    minX = Math.min(minX, xValue);
                    maxX = Math.max(maxX, xValue);
                }
            }

            @Override
            public void handleSuccess() {
                super.handleSuccess();
                final double x[] = toArray(xValues);
                final double y[] = toArray(yValues);

                // This part needs to run on the UI thread since it updates the chart SWT control
                Display.getDefault().asyncExec(new Runnable() {

                    @Override
                    public void run() {
                        chart.getSeriesSet().getSeries()[0].setXSeries(x);
                        chart.getSeriesSet().getSeries()[0].setYSeries(y);

                        // Set the new range
                        if (!xValues.isEmpty() && !yValues.isEmpty()) {
                            chart.getAxisSet().getXAxis(0).setRange(new Range(0, x[x.length - 1]));
                            chart.getAxisSet().getYAxis(0).setRange(new Range(minY, maxY));
                        } else {
                            chart.getAxisSet().getXAxis(0).setRange(new Range(0, 1));
                            chart.getAxisSet().getYAxis(0).setRange(new Range(0, 1));
                        }
                        chart.getAxisSet().adjustRange();

                        chart.redraw();
                    }
                });
            }
To display the time stamps on the X axis nicely, we need to specify a format or else the time stamps will be displayed as long. We use TmfTimestampFormat to make it consistent with the other TMF views. We also need to handle the TmfTimestampFormatUpdateSignal to make sure that the time stamps update when the preferences change.
    @Override
    public void createPartControl(Composite parent) {
        ...

        chart.getAxisSet().getXAxis(0).getTick().setFormat(new TmfChartTimeStampFormat());
    }

    public class TmfChartTimeStampFormat extends SimpleDateFormat {
        private static final long serialVersionUID = 1L;
        @Override
        public StringBuffer format(Date date, StringBuffer toAppendTo, FieldPosition fieldPosition) {
            long time = date.getTime();
            toAppendTo.append(TmfTimestampFormat.getDefaulTimeFormat().format(time));
            return toAppendTo;
        }
    }

    @TmfSignalHandler
    public void timestampFormatUpdated(TmfTimestampFormatUpdateSignal signal) {
        // Called when the time stamp preference is changed
        chart.getAxisSet().getXAxis(0).getTick().setFormat(new TmfChartTimeStampFormat());
        chart.redraw();
    }
We also need to populate the view when a trace is already selected and the view is opened. We can reuse the same code by having the view send the TmfTraceSelectedSignal to itself.
    @Override
    public void createPartControl(Composite parent) {
        ...

        ITmfTrace trace = getActiveTrace();
        if (trace != null) {
            traceSelected(new TmfTraceSelectedSignal(this, trace));
        }
    }
The view is now ready but we need a proper trace to test it. For this example, a trace was generated using LTTng-UST so that it would produce a sine function.
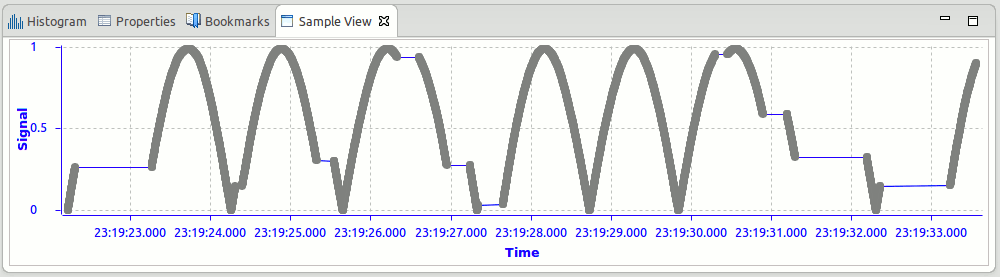
In summary, we have implemented a simple TMF view using the SWTChart library. We made use of signals and requests to populate the view at the appropriate time and we formated the time stamps nicely. We also made sure that the time stamp format is updated when the preferences change.
The pin feature allows pinning a view to a specific trace. A pinned view will not synchronize on active trace changes. How the view implements the pinning and unpinning is up to the view itself.
Sub-classes of TmfView may optionally support the pin feature by implementing the ITmfPinnable interface. The view then provides a pin button in its toolbar.
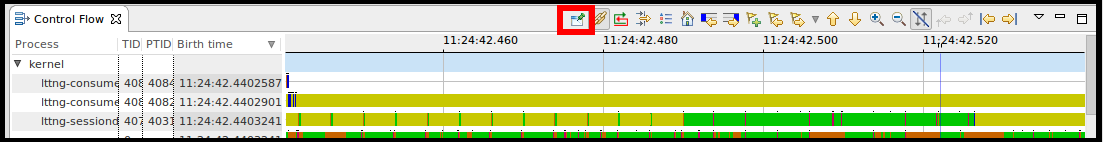
It is the view's responsibility to take the proper actions when the view is pinned.
    @Override
    public synchronized void setPinned(ITmfTrace trace) {
        if (trace != null) {
           /* pinned code */
        } else {
           /* unpinned code */
        }
    }
TMF provides base implementations for several types of views and viewers for generating custom X-Y-Charts, Time Graphs, or Trees. They are well integrated with various TMF features such as reading traces and time synchronization with other views. They also handle mouse events for navigating the trace and view, zooming or presenting detailed information at mouse position. The code can be found in the TMF UI plug-in org.eclipse.tracecompass.tmf.ui. See below for a list of relevant java packages:
Several features in TMF and the Eclipse LTTng integration are using this framework and can be used as example for further developments:
Trace Compass provides base implementations for timing views and viewers for generating Latency Tables, Scatter Charts, Density Graphs and Statistics Tables. They are well integrated with various Trace Compass features such as reading traces and time synchronization with other views. They also handle mouse events for navigating the trace and view, zooming or presenting detailed information at mouse position. The code can be found in the Analysis Timing plug-in org.eclipse.tracecompass.analysis.timing.ui. See below for a list of relevant java packages:
A default implementation of some of those views can be used by analyzes without requiring to extend existing classes. It just needs to use the default view's ID as primary ID and the analysis ID as the secondary ID.
Several features in Trace Compass are using this framework and can be used as example for further development:
|
|

|
|
| Implementing a New Trace Type | Component Interaction |