Trace Compass supports the raw textual format and binary format (version 6) of various ftrace plugins.
See the trace-cmd.dat man page for more information on the binary ftrace format (version 6).
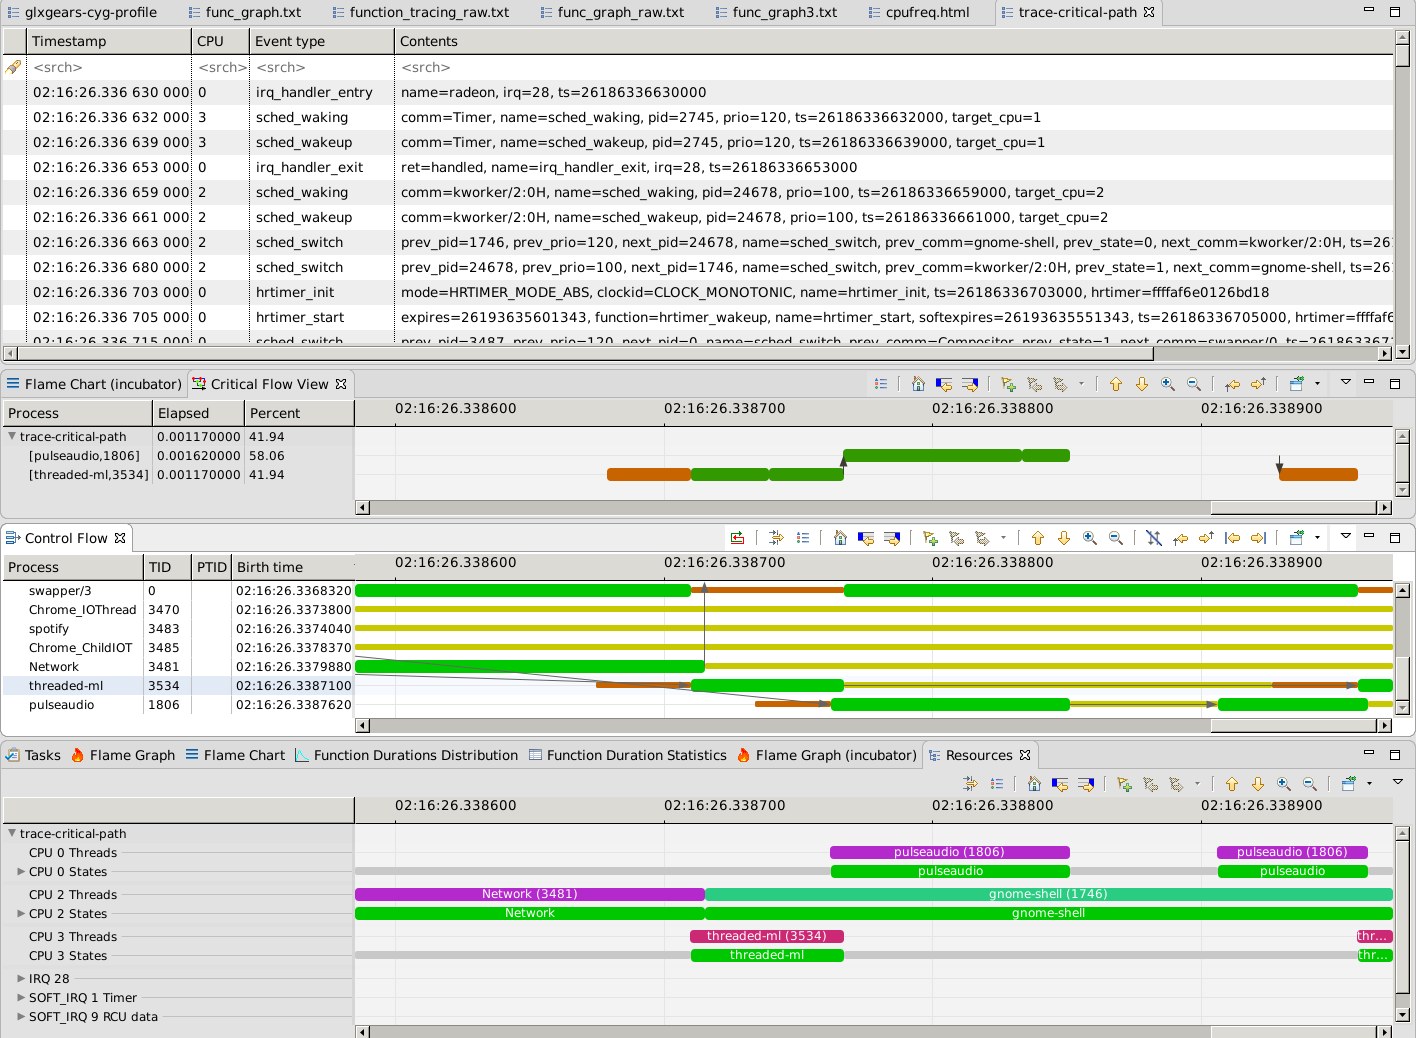
ftrace traces with kernel events are kernel traces and all analyses available with other kernel traces in Trace Compass are made available for those traces: Kernel resources and threads analyses, I/O, memory, critical path, etc.
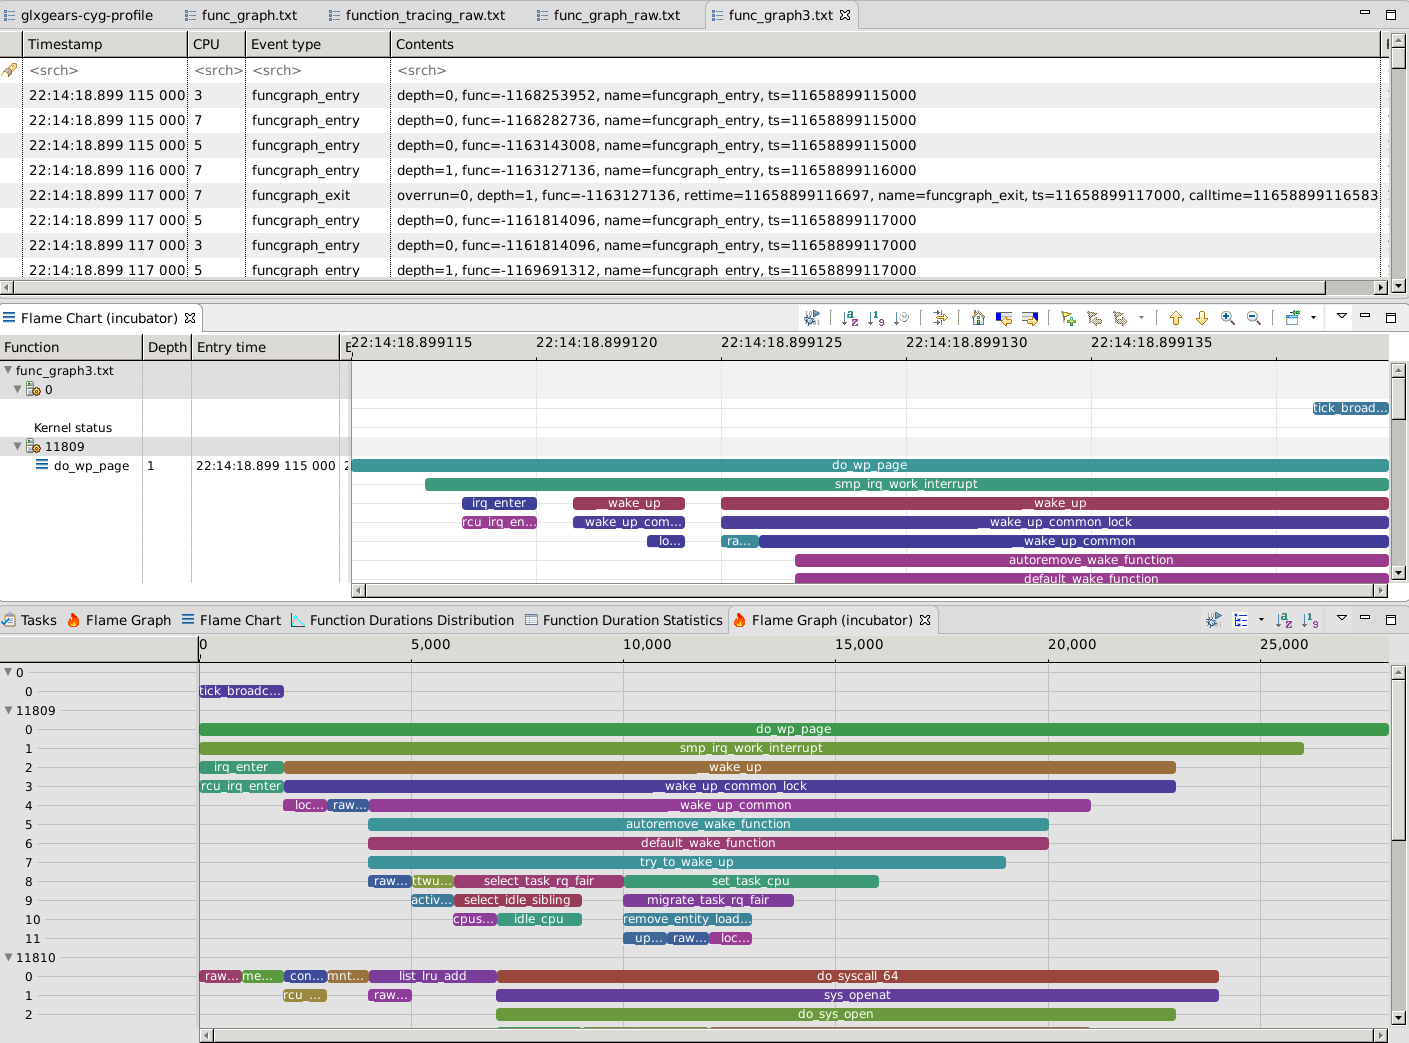
The function graph plugin of ftrace allows to record the function entry and exits of various kernel functions. With this kind of trace, we can obtain a callstack / flame chart / flame graph for the various threads on the machine. To get these views, you need to install the Generic Callstack add-ons from the Incubator (using Tools -> Add-ons).
To resolve the symbols correctly in the trace, you'll need the symbols from the kernel, that you can get with the
sudo cat /proc/kallsyms > kallsyms.txt command. The symbols can be configured for the trace, either by clicking the
 icon in the view's toolbars, or right-clicking on the trace and selecting
Configure symbols. The Trace Compass documentation has more information on
configuring symbols.
icon in the view's toolbars, or right-clicking on the trace and selecting
Configure symbols. The Trace Compass documentation has more information on
configuring symbols.
There are two ways to generate an ftrace trace, using ftrace via the debugfs filesystem or using the trace-cmd command-line tool.
Use the debugfs filesystem to generate a trace in human readable raw format.
Mount the debugfs filesystem using the following command:
# mount -t debugfs nodev /sys/kernel/debug
The filesystem could be mounted elsewhere.
Before starting the tracer, traced events must be enabled by echoing 1 in the correct files. For example, enabling sched_switch, sched_wakeup and syscall tracing is done with the following commands:
 # echo 1 > /sys/kernel/debug/tracing/events/sched/sched_wakeup/enable
 # echo 1 > /sys/kernel/debug/tracing/events/sched/sched_switch/enable
 # echo 1 > /sys/kernel/debug/tracing/events/syscalls/enable
Recording of a trace is started by echoing 1 in tracing_on:
# echo 1 > /sys/kernel/debug/tracing/tracing_on
Recording is stopped by echoing 0 in the same file. The trace can be obtained in raw format in the trace file:
# cat /sys/kernel/debug/tracing/trace > myFtraceFile.txt
Trace-cmd can be used to generate traces in binary format or human readable format. Currently, the only supported binary ftrace version is 6. Before generating the traces, make sure to have the latest version of trace-cmd (>= 2.9) and related libraries if not installed (libtraceevents and libtracefs).
The following section describes how to generate a trace in human readable raw format using trace-cmd.
Recording of a trace can be started by the following command:
# trace-cmd record -e sched_switch -e sched_wakeup
The trace is recorded in binary format in the trace.dat file. In the example above, the recorded trace would contain only sched_switch and sched_wakeup events.
To obtain a human readable trace, first follow the instructions to produce a trace in binary format described in the preceeding section.
Next, outputting the recorded trace is done using the following command:
# trace-cmd report -R
The -R argument is needed to get the raw format.
To obtain a function graph with ftrace, tracing can be done with the following command. As the function graph can be quite big, using the -F flag allows to trace the calls only for the command being traced, here ls. The resulting trace will contain symbols. To resolve the symbols, the kernel symbols should be exported from the command line and configured in Trace Compass.
 # sudo trace-cmd record -p function_graph -F ls
 # sudo trace-cmd report -R
 # cat /proc/kallsyms > kallsyms
See the trace-cmd documentation for more tracing options.