Let’s focus on adding execution specific features to the language.
This includes enabling animation and representing the dynamic part of the language. Ie. the data and relevant information that change during the model execution.
Some feature may be generic and available for any languages, some may be domain specific and require some customization dedicated to the language.
The multidimentional trace is a mecanism that enable some extra feature in the debugger in the Modeling workbench. This turns the debugger into an omniscient debugger with forward/backward features and advanced visualization of data changes in the model.
This feature can be enabled by using the generator on top of the xdsml project and generate the Trace Addon Project.
TODO complete this section.
The debug layer is an extension on top of a graphical editor defined with Sirius which represents runtime data and the current instruction. See Section 3.2, “Defining a Concrete Syntax with Sirius” for more details about Sirius. This section covers the debug representation creation wizard and the technical implementation details. Technical implementation details are only useful for advanced use case and troubleshooting.
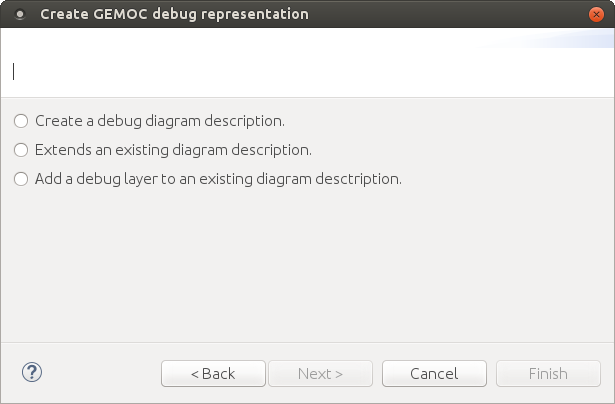
This wizard creates a layer to represent the current instruction and add commands in order to manage breakpoints and launch a simulation in debug mode. This is a default implementation, it can be customized to represent runtime data for instance. The customization uses the Sirius description definition, see the Sirius Specifier Manual for more details. The wizard presents three ways to implement this layer:
- Create a debug diagram description
- Extend an existing diagram description
- Add a debug layer to an existing diagram description
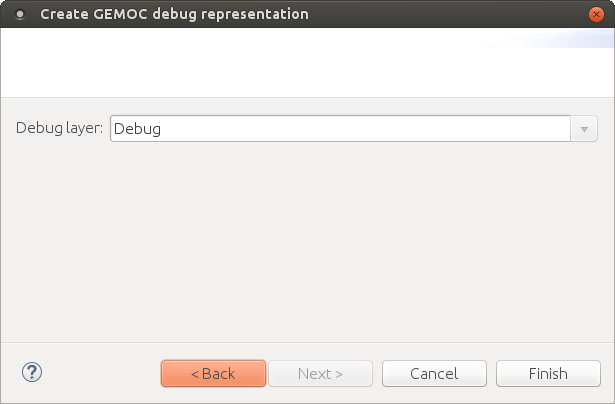
It creates a diagram representation with a default debug layer. The representation does not depend on another representation. A typical use case is a language where the runtime data representation is too far from the language graphical syntax.


It creates a diagram representation with a default debug layer that extends an existing representation. This allows to have a debug layer based on the representation of the language concrete syntax. The language concrete syntax can be deployed without the debug representation. A typical use case is the reuse of an existing diagram definition that you cannot modify by yourself. For instance if you want to use UML, you can reuse the UML Designer.
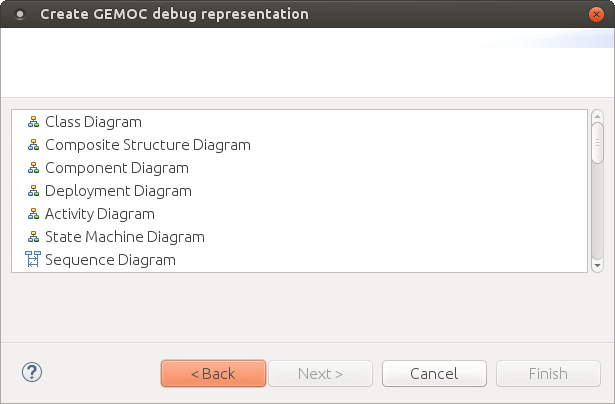
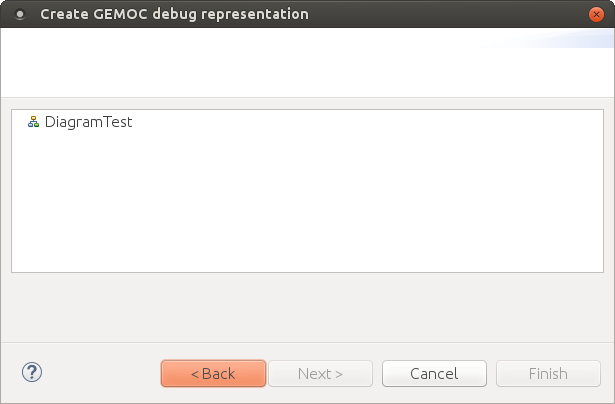
You can select any diagram description.
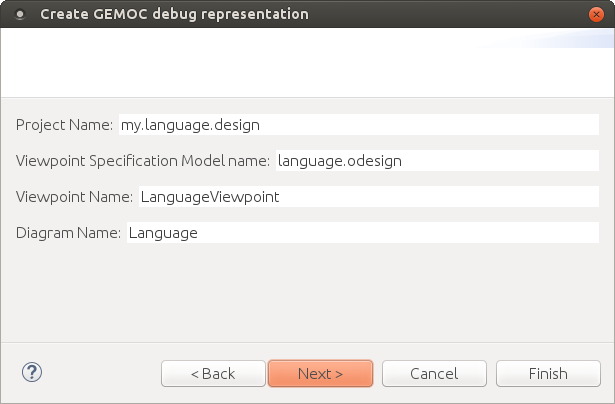
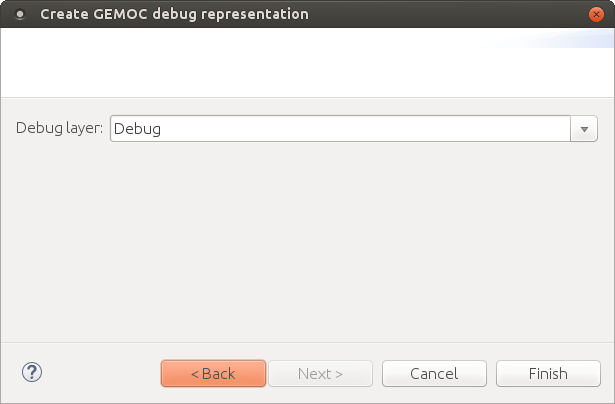
And then define the new diagram description which extends the one you previously selected.
Implementation details are for advanced use and troubleshooting. It explains how the implementation works behind the scene. There are two main elements covered here : the debugger services class and the debug layer itself.
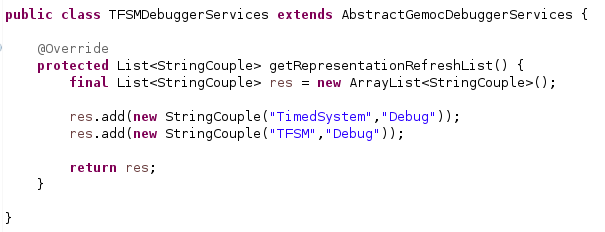
The debugger services class is use to tell which representations should be activated and refreshed during debug (see the getRepresentationRefreshList() method). It also provides a method to know if an element of the diagram is the current instruction. This is provided by the isCurrentInstruction() method.
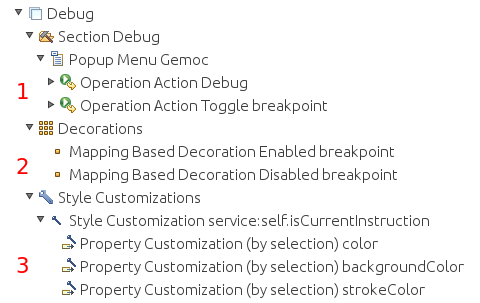
The default debug layer adds action to start the simulation in debug mode and to toggle breakpoints (1). When a breakpoint exists for an element of the diagram, a visual feedback is displayed according to the breakpoint state (2). The current instruction is also highlighted in yellow by default (3).
This is a default debug layer, it can be customized to fit your needs. The customization use the Sirius description definition, see the Sirius Specifier Manual for more details.
One benefit of assigning an execution semantics onto a DSL is to pave the way for exhaustive exploration. Exhaustive exploration is a technique used in complex and safety system design to ensure the correct adequacy between the system requirements and the real behavior of the system. This is made possible by exploring and verifying properties on an exhaustive finite state space of the system representing the whole set of relevant configurations your system may reach.
Gemoc provides the first step towards exploration and verification by building the graph of all the possible schedules of a system model constrained with MoCCML. It can then be used in a model-checking tool to verify behavioral properties of the MoCCML models. Thanks to Gemoc approach the execution model is explicited and can be manipulated to for instance:
- Verify temporal logic properties (safety and liveness) on the state space graph structure;
- Extract a schedule that optimizes specific objectives;
- Extract system properties by static analysis of an event-graph representation of the execution model.
In the Gemoc approach the steps toward exploration and verification during language design are:
- Define an executable model and its mapping on a DSL(we assume it has already been defined see Section 2.2, “Defining a Model of Concurrency and Communication (MoCC)”);
- Generate a configuration file from ECL model to target an exhaustive exploration tool;
In the Gemoc approach the steps toward exploration and verification during modeling design are described in Section 1, “Exhaustive Exploration and Verification at Model Design Time”: The flow toward exhaustive exploration and verification in Gemoc is presented in figure Figure 5, “The exploration and verification flow in Gemoc” and described in the following sections.
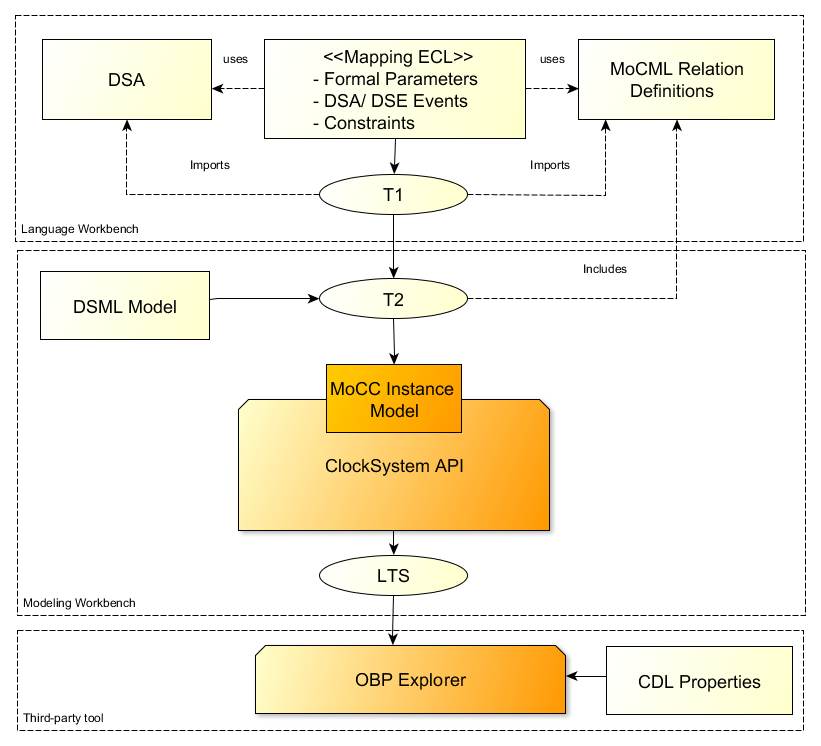
ECL specification is the starting point toward exploration. In this specification we define events associated with the actions of the DSA and also events associated with the DSE events. On these event bindings we apply the MoccML relations of the MoC Library to schedule the events. A finite state space of a system uses such scheduling constraints and therefore a configuration file to target an exhaustive exploration tool must be generated:
T1 transformation generates a configuration file to later target exhaustive exploration or simulation tools. T1 takes as input the ECL mapping definition between the DSL and the MoCCML to generate a transformation T2 describing transformation rules that will be used to produce the processes for the DSL related functions and data (DSA) and the behavioral processes corresponding to the MoCCML constraints.
T1 is automatically generated from ecl model and results are stored in mtl-gen folder.
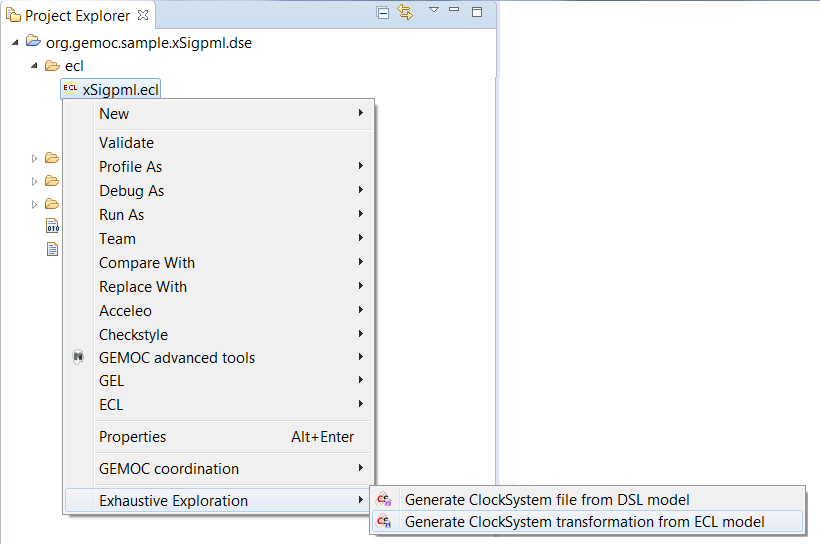
However to execute T1 manually right-click on the ECL file → ![]() Exhaustive Exploration →
Exhaustive Exploration → ![]() Generate ClockSystem transformation from ECL model as illustrated in figure Figure 6, “Using T1 Tranformation”.T2 is generated in the repository <mtl-gen>.
Generate ClockSystem transformation from ECL model as illustrated in figure Figure 6, “Using T1 Tranformation”.T2 is generated in the repository <mtl-gen>.
[13] asciidoc source of this page: https://github.com/eclipse/gemoc-studio/tree/master/docs/org.eclipse.gemoc.studio.doc/src/main/asciidoc/userguide/lw_ProvideLanguageWithTools_headContent.asciidoc.
[14] asciidoc source of this page: https://github.com/eclipse/gemoc-studio-modeldebugging/tree/master/trace/generator/plugins/org.eclipse.gemoc.trace.gemoc.ui/docs/asciidoc/user_lw_GenerateTraceMetamodel.asciidoc.
