This plugin contains additional analyses for kernel traces.
The LTTng Context Callstack analysis adds views for LTTng kernel traces with events that have the callstack context.
To obtain traces that can use this analysis, you need to add either or both of the following contexts in your LTTng kernel trace:
   lttng add-context -k -t callstack-kernel
   lttng add-context -k -t callstack-user
This will add a context for events that is an array of the callstack at the moment of the event, the kernel callstack being the functions in the kernel and the callstack-user is the callstack of the userspace application that was running at the moment of the event.
Once the trace is opened, in order to make sense of the binary symbols that are the callstack, you'll need the configure the symbols for the trace. Right-click on the trace in the Project Explorer and select Configure Symbols.
The symbol file for the kernel callstack can be obtained by getting the kallsyms file:
sudo cat /proc/kallsyms > mykernelkallsyms.txt
For the userspace callstack, they can be obtained from a few methods. Read the Trace Compass LTTng-UST documentation for how to resolve symbols.
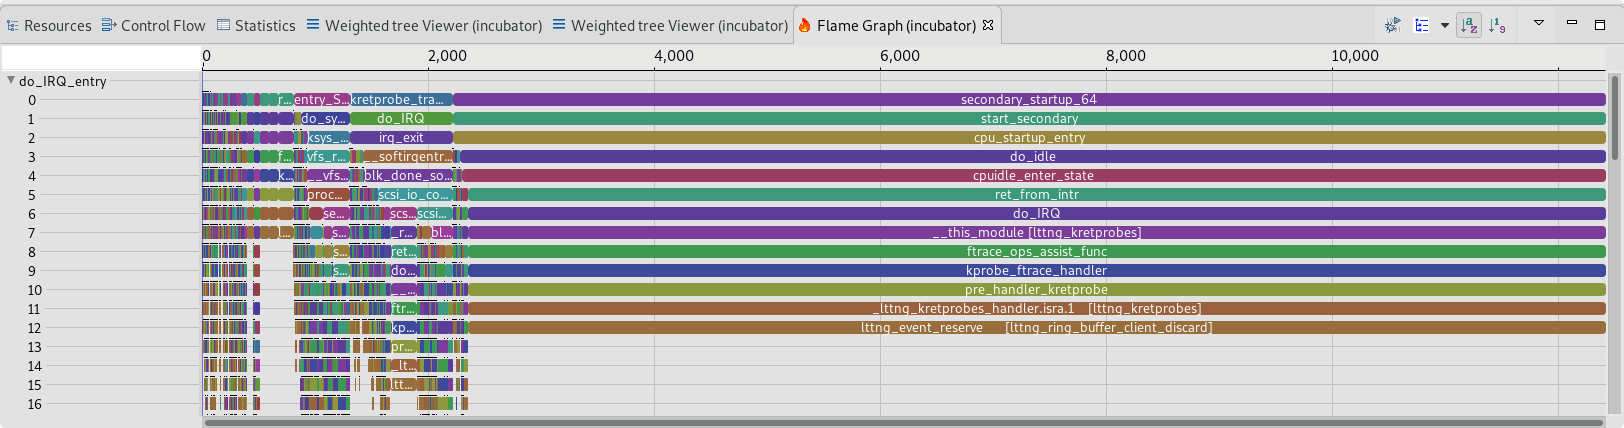
The first view this analysis populates is the Flame Graph view. It shows the sum of all the callstacks, per event, for the whole trace.
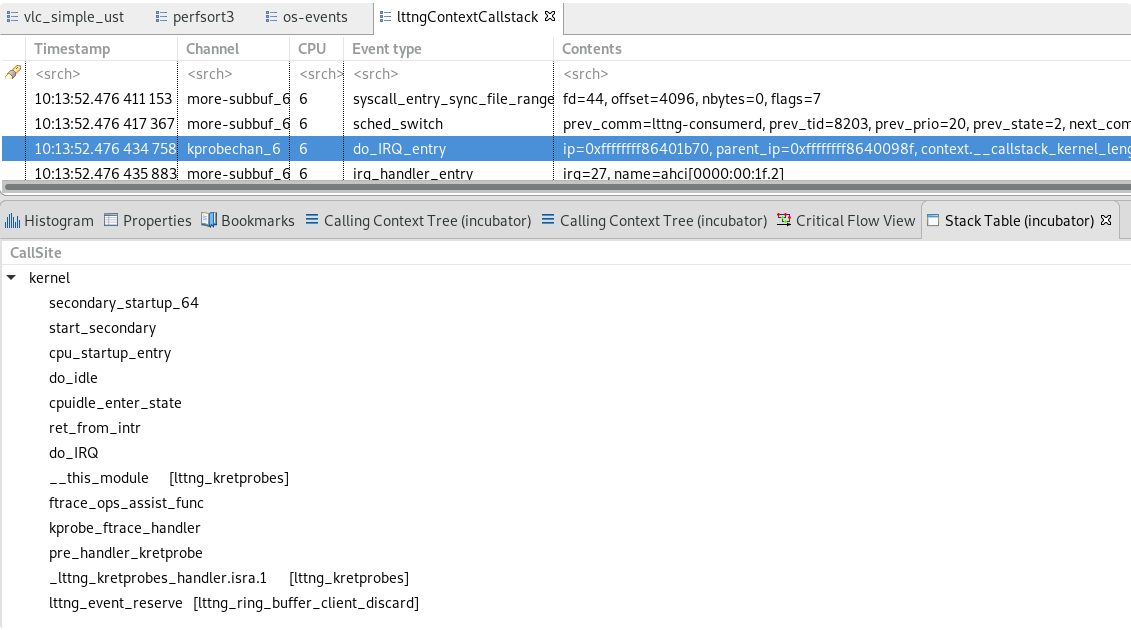
Another view is the Stack Table which shows the callstack for the selected event.