
| Trace synchronization | ||
|---|---|---|

|

|
|
| LTTng-UST Analyses | Time offsetting | |
It is possible to synchronize traces from different machines so that they have the same time reference. Events from the reference trace will have the same timestamps as usual, but the events from traces synchronized with the first one will have their timestamps transformed according to the formula obtained after synchronization.
To synchronize traces from different machines, they need to exchange packets through the network and have events enabled such that the data can be matched from one trace to the other. For now, only TCP packets can be matched between two traces.
LTTng traces that can be synchronized are obtained using one of three methods below. All methods are compatible so a trace on one host taken with one method can be synchronized with a trace on another host taken with another method:
As of LTTng-modules 2.9, the net_dev_queue and net_if_receive_skb tracepoints contain all the necessary data to synchronize the traces.
The tracepoints net_dev_queue and netif_receive_skb will be used for synchronization. Both tracepoints are available in lttng-modules since version 2.2, but they do not contain sufficient data to be used to synchronize traces.
An experimental branch introduces this extra data: lttng-modules will need to be compiled by hand.
Obtain the source code for the experimental lttng-modules
   # git clone git://git.dorsal.polymtl.ca/~gbastien/lttng-modules.git
   # cd lttng-modules
Checkout the net_data_experimental branch, compile and install lttng-modules as per the lttng-modules documentation
   # git checkout net_data_experimental
   # make
   # sudo make modules_install
   # sudo depmod -a
This experimental branch adds IP, IPv6 and TCP header data to the tracepoints. Packets received and sent with other protocols do not have this extra header data, but all packets are captured.
This method adds dynamic instrumentation on TCP packets via extra kernel modules. Only TCP packets are captured.
Obtain the source code, along with lttng-modules
   # git clone https://github.com/giraldeau/lttng-modules.git
   # cd lttng-modules
Checkout the addons branch, compile and install lttng-modules as per the lttng-modules documentation. The make command will fail at first with a message about the unset SYSMAP variable. Instructions on how to generate a System.map are mentioned in the error message.
   # git checkout addons
   # make
   # (follow the instructions to obtain the System.map file and set the SYSMAP variable)
   # make
   # sudo make modules_install
   # sudo depmod -a
The lttng-addons modules must be inserted manually for the TCP tracepoints to be made available.
   # sudo modprobe lttng-addons
   # sudo modprobe lttng-probe-addons
The following tracepoints will be available
   # sudo lttng list -k
   Kernel events:
   -------------
     ...
     inet_sock_create (loglevel: TRACE_EMERG (0)) (type: tracepoint)
     inet_sock_delete (loglevel: TRACE_EMERG (0)) (type: tracepoint)
     inet_sock_clone (loglevel: TRACE_EMERG (0)) (type: tracepoint)
     inet_accept (loglevel: TRACE_EMERG (0)) (type: tracepoint)
     inet_connect (loglevel: TRACE_EMERG (0)) (type: tracepoint)
     inet_sock_local_in (loglevel: TRACE_EMERG (0)) (type: tracepoint)
     inet_sock_local_out (loglevel: TRACE_EMERG (0)) (type: tracepoint)
     ...
The ones used for trace synchronization are inet_sock_local_in and inet_sock_local_out.
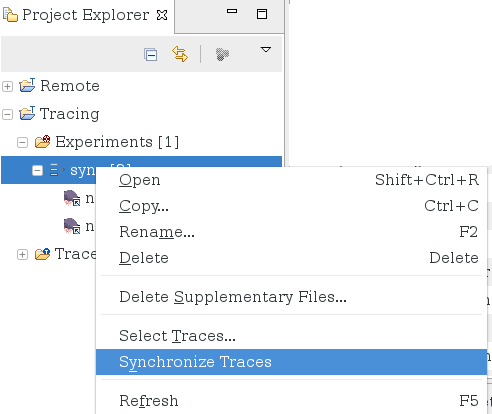
In order to synchronize traces, create a new experiment and select all traces that need to be synchronized. Right-click on the experiment and select Synchronize traces. For each trace whose time needs to be transformed, a new trace named as the original but followed by a '_' will be created with the transformed timestamps, and the original trace will be replaced in the experiment. The original trace can still be accessed under the Traces folder.

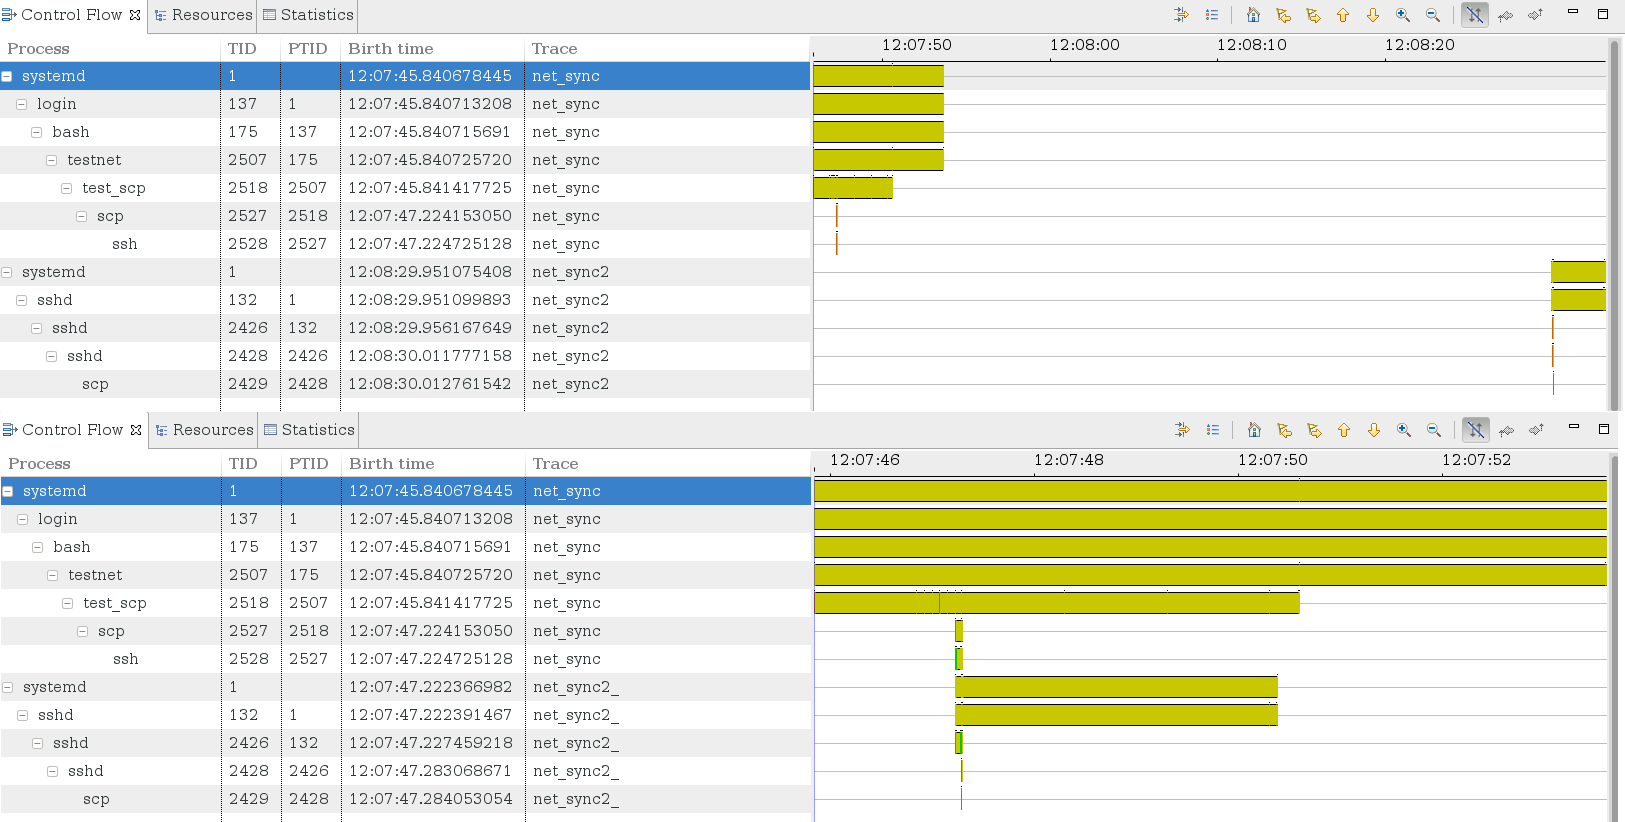
When opening the experiment now, all the views will be synchronized. The following screenshot presents the differences in the filtered Control Flow View before and after the time synchronization.

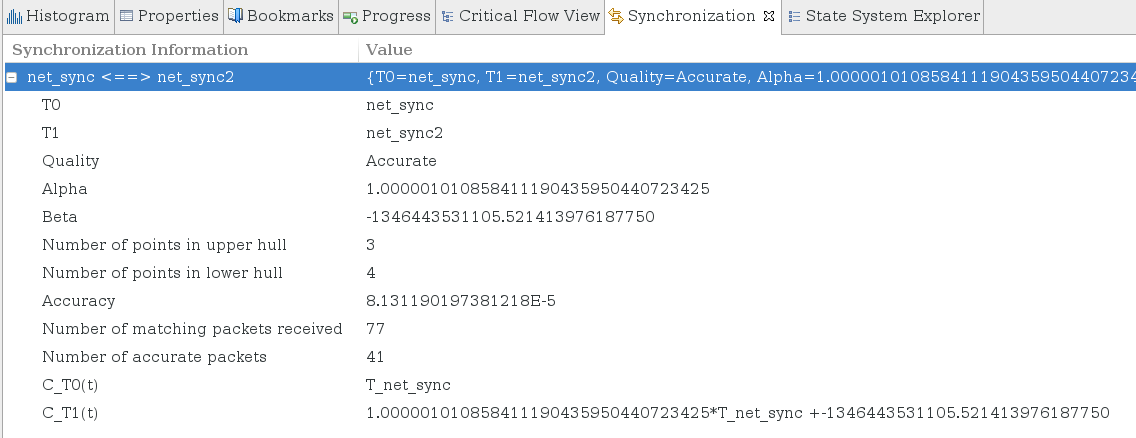
Information on the quality of the synchronization, the timestamp transformation formula and some synchronization statistics can be visualized in the Synchronization view. To open the Synchronization view, use the Eclipse Show View dialog ( Window -> Show View -> Other...). Then select Synchronization under Tracing.


|

|

|
| LTTng-UST Analyses | Time offsetting |