Sample Project: Payroll
The program payroll is provided just to show the basic functionality of the C/C++ Development Plugin.
- Create a C/C++ Project
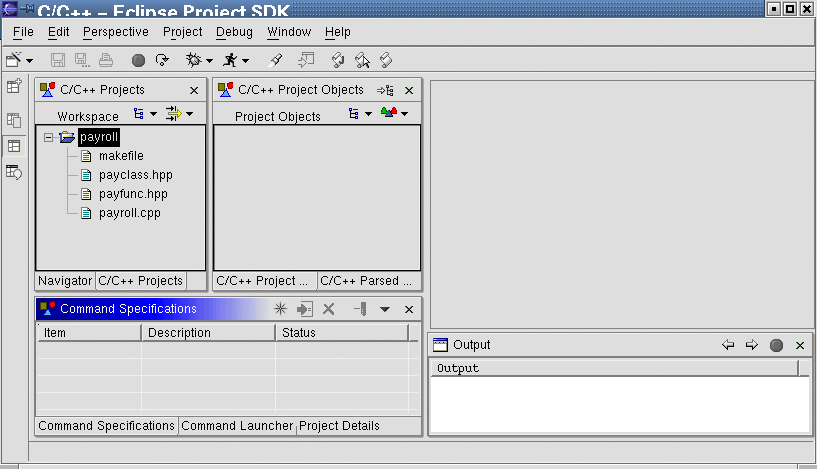
Make sure you are in the C/C++ perspective (Perspective->Open->Other...C/C++). Create a C/C++ Project (File->New->C/C++ Project). Enter a project name (e.g "payroll") and specify as its resource location the local directory that contains the source files. i.e. click on the Browse button and find the location of the folder
"plugins/com.ibm.cpp.docs.user/sample/payroll". Set the Parse Include Path (optional) to the include directory of your compiler.(e.g."/usr/include/g++-3")
- Parsing the source files
After the project creation, you will see the project in the C/C++ Projects view. Expand the folder by clicking on the + sign to see its contents (i.e. the source files). To parse the source files, right-click on the project (in the Navigator view) and select the Parse...Begin Parse option. Open any file by double-cliking its filename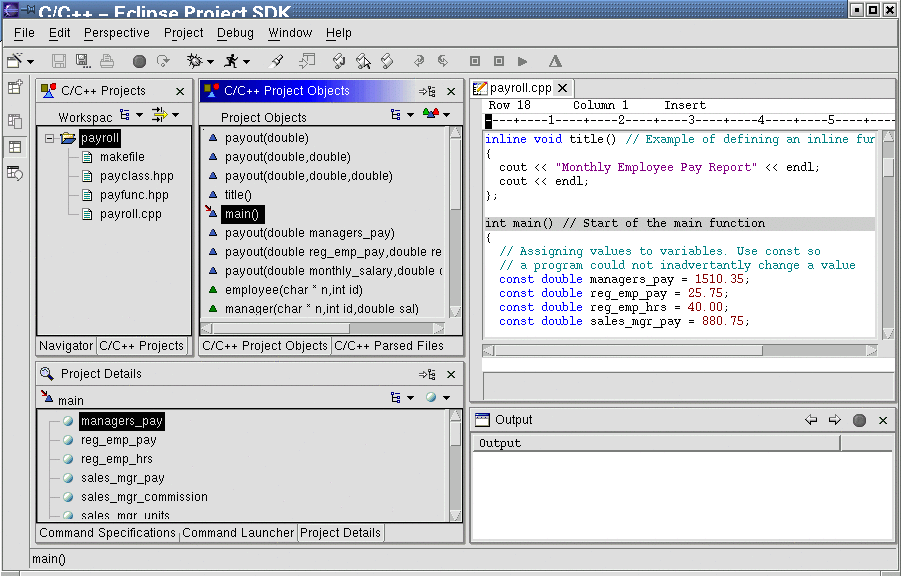
- The C/C++ Parsed-Files view contains the list of source files that have been parsed.The Project Details view displays the contents of the object selected in the Parsed-Files view. Double-click on any object and the Editor view would display the source file and you would be positioned at the line where the object occurs. Some of the parsed objects are themselves expandable (e.g. functions) so you can click on the + sign to see the content of the functions.The C/C++ System-Objects view (Perspective->Show view->C/C++ System Objects) displays the objects parsed from the include directory ( you can avoid parsing them by not specifying the "Parse Include path" from the "Properties" option).
NOTE: If you want to specify the types of files to parse such as
.cc .Cetc. you can add them to the"<homedir>/eclipse/plugins/com.ibm.cpp.miners.parser/CPPExtensions.dat"file.
- Using Views To Navigate The Project
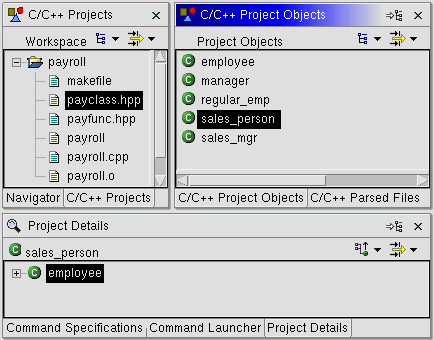
To quickly find all classes in our project set the filter of the C/C++ Project Objects view to "Classes/Structs". Double-click the
 "sales_person"class to see its source location in the editor. Then with the"sales_person"class still selected in the C/C++ Projects view go to theProject Detailsview and set its filter to Derived Classes. Now you would see that"sales_mgr"is derived from"sales_person".
Now, change the filter in the Project Details view to contents and you would see all members of
 sales_person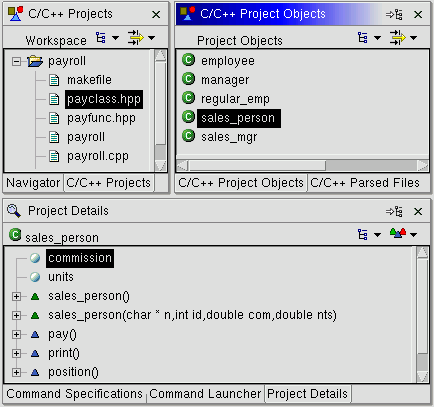
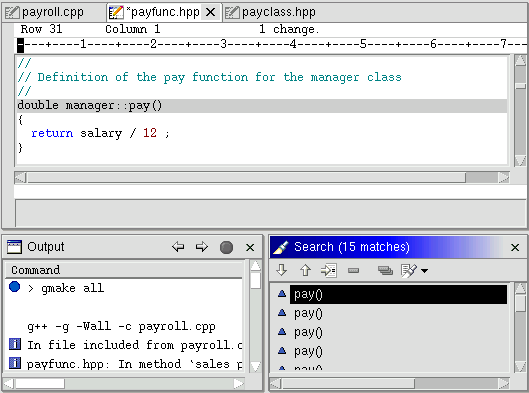
You can find a function with the Search facility. Bring the Search Dialog bo by clicking on the search icon below the menu bar . Then select C/C++ Search, enter
 "pay.*"as the search expression and specify a search for a "Function" with "regular expression" enabled. From the results displayed in theSearchview, double click on any of the results and the editor would show its source location.
- Build (Compiling) projects
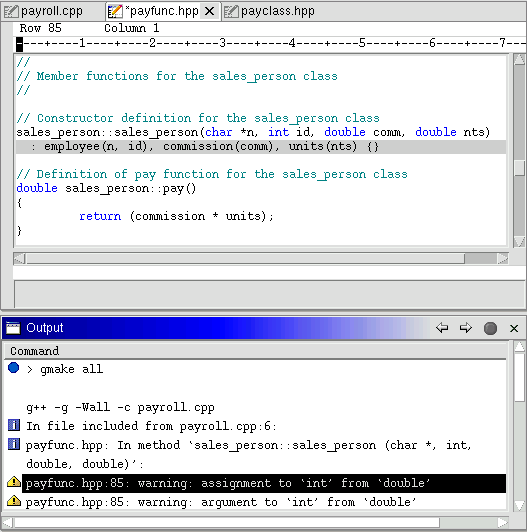
By default the Automatic Build Feature is enabled so the project builds automatically once a resource (e.g. a source file) has been modified, but you can disable this option (->Window->Preferences).If you disable Automatic build, you will need to right-click on the project and select the Build Project option (A build will execute the command that was specified as the Build invocation, in our case it would be defaultgmake all). Any output that the build produces (e.g. error messages or warnings) will be displayed in the Output view. Double click on a warning and the editor would redirect you to the line where it occurs.
- RUNNING the project
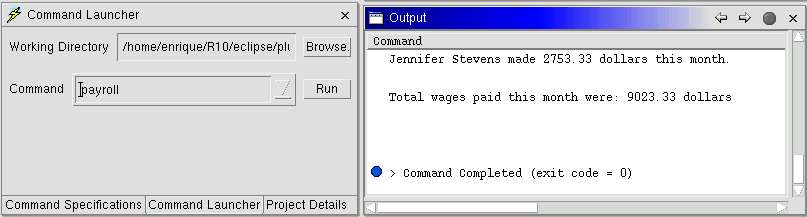
You run the newly created executable from the Command Launcher view. e.g. for the payroll project enter "payroll" as the command to run in the Command Launcher view. The output of the program will be displayed in the Output view.
- Closing the project
Go to the C/C++ Projects view, right-click on the project to open its submenu, and select the Close option.
- Parsing the source files
 in the toolbar.(Debug->Start a C/C++ Application).
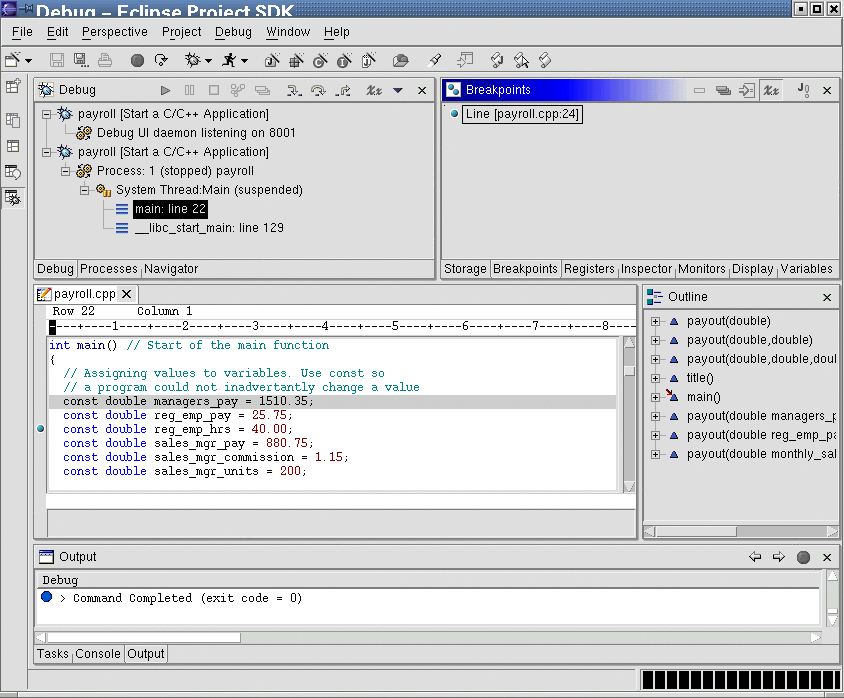
 in the
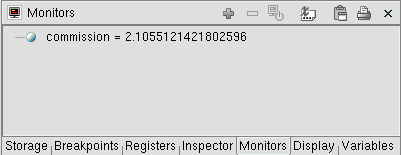
  and see how their values change as we step.
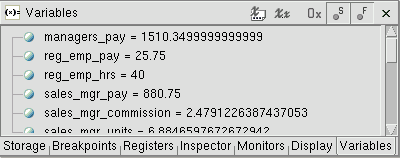
 to step into the body of a function and
  to return from it.